2017-11-09 13:55:00


EIA: OIL PRICE $53 - $56


EIA - SHORT-TERM ENERGY OUTLOOK
Global liquid fuels
North Sea Brent crude oil spot prices averaged $58 per barrel (b) in October, an increase of $1/b from the average in September. EIA forecasts Brent spot prices to average $53/b in 2017 and $56/b in 2018.
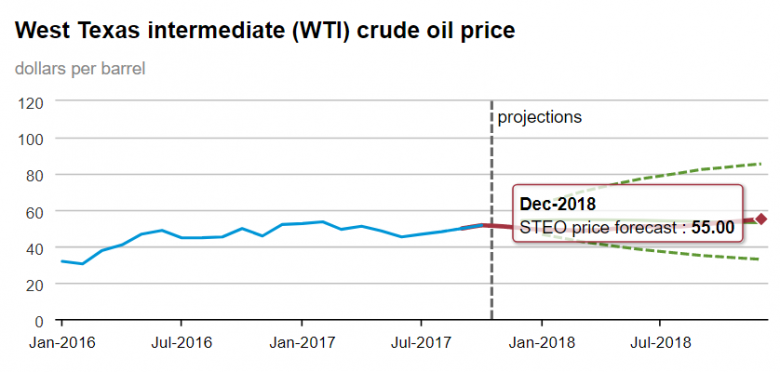
West Texas Intermediate (WTI) crude oil prices are forecast to average almost $5/b lower than Brent prices in 2018. After averaging $2/b lower than Brent prices through the first eight months of 2017, WTI prices averaged $6/b lower than Brent prices in September and October. The spread between Brent and WTI prices is expected to remain at this level through the first quarter of 2018 before narrowing to $4/b during the second half of 2018.
NYMEX contract values for February 2018 delivery that traded during the five-day period ending November 2 suggest that a range of $45/b to $67/b encompasses the market expectation for February WTI prices at the 95% confidence level.
EIA estimates U.S. crude oil production averaged 9.3 million barrels per day (b/d) in October, down 90,000 b/d from the September level. Crude oil production in the Gulf of Mexico averaged 1.4 million b/d in October, which was 260,000 b/d lower than the September level. The lower production reflected the effects of Hurricane Nate. At the time of publication, most oil production platforms in the Gulf of Mexico had returned to operation following the hurricane, and EIA forecasts overall U.S. crude oil production will continue to grow in the coming months. EIA forecasts total U.S. crude oil production to average 9.2 million b/d for all of 2017 and 9.9 million b/d in 2018, which would mark the highest annual average production, surpassing the previous record of 9.6 million b/d set in 1970.
Natural gas
U.S. dry natural gas production is forecast to average 73.4 billion cubic feet per day (Bcf/d) in 2017, a 0.6 Bcf/d increase from the 2016 level. Natural gas production in 2018 is forecast to be 5.5 Bcf/d higher than the 2017 level.
In October, the average Henry Hub natural gas spot price was $2.88 per million British thermal units (MMBtu), down 10 cents/MMBtu from the September level. Expected growth in natural gas exports and domestic natural gas consumption in 2018 contribute to the forecast Henry Hub natural gas spot price rising from an annual average of $3.01/MMBtu in 2017 to $3.10/MMBtu in 2018. NYMEX contract values for February 2018 delivery that traded during the five-day period ending November 2 suggest that a range of $2.08/MMBtu to $4.52/MMBtu encompasses the market expectation for February Henry Hub natural gas prices at the 95% confidence level.
Prices
North Sea Brent crude oil spot prices averaged $58 per barrel (b) in October, an increase of $1/b from the average in September. EIA forecasts Brent spot prices to average $53/b in 2017 and $56/b in 2018.
West Texas Intermediate (WTI) crude oil prices are forecast to average almost $5/b lower than Brent prices in 2018. After averaging $2/b lower than Brent prices through the first eight months of 2017, WTI prices averaged $6/b lower than Brent prices in September and October. The spread between Brent and WTI prices is expected to remain at this level through the first quarter of 2018 before narrowing to $4/b during the second half of 2018.
In October, the average Henry Hub natural gas spot price was $2.88 per million British thermal units (MMBtu), down 10 cents/MMBtu from the September level. Expected growth in natural gas exports and domestic natural gas consumption in 2018 contribute to the forecast Henry Hub natural gas spot price rising from an annual average of $3.01/MMBtu in 2017 to $3.10/MMBtu in 2018. NYMEX contract values for February 2018 delivery that traded during the five-day period ending November 2 suggest that a range of $2.08/MMBtu to $4.52/MMBtu encompasses the market expectation for February Henry Hub natural gas prices at the 95% confidence level.
Natural Gas
U.S. dry natural gas production is forecast to average 73.4 billion cubic feet per day (Bcf/d) in 2017, a 0.6 Bcf/d increase from the 2016 level. Natural gas production in 2018 is forecast to be 5.5 Bcf/d higher than the 2017 level.
In October, the average Henry Hub natural gas spot price was $2.88 per million British thermal units (MMBtu), down 10 cents/MMBtu from the September level. Expected growth in natural gas exports and domestic natural gas consumption in 2018 contribute to the forecast Henry Hub natural gas spot price rising from an annual average of $3.01/MMBtu in 2017 to $3.10/MMBtu in 2018. NYMEX contract values for February 2018 delivery that traded during the five-day period ending November 2 suggest that a range of $2.08/MMBtu to $4.52/MMBtu encompasses the market expectation for February Henry Hub natural gas prices at the 95% confidence level.
Renewables and Carbon Dioxide Emissions
Wind electricity generating capacity at the end of 2016 was 82 gigawatts (GW). EIA expects wind capacity additions in the forecast to bring total wind capacity to 88 GW by the end of 2017 and to 96 GW by the end of 2018.
Total utility-scale solar electricity generating capacity at the end of 2016 was 22 GW. EIA expects solar capacity additions in the forecast will bring total utility-scale solar capacity to 27 GW by the end of 2017 and to 31 GW by the end of 2018.
After declining by 1.6% in 2016, energy-related carbon dioxide (CO2) emissions are projected to decrease by 0.8% in 2017 and then to increase by 2.1% in 2018. Energy-related CO2 emissions are sensitive to changes in weather, economic growth, and energy prices.
-----
Earlier:

October, 30, 11:45:00
OIL PRICES WILL UP TO $56WBG - Oil prices are forecast to rise to $56 a barrel in 2018 from $53 this year as a result of steadily growing demand, agreed production cuts among oil exporters and stabilizing U.S. shale oil production, while the surge in metals prices is expected to level off next year, the World Bank said.
|

October, 25, 12:30:00
OIL PRICES NO OPPORTUNITIES"They [big OPEC and Middle Eastern producers] cannot be too ambitious [on their oil price targets]...there's not much [upside] room for them to hope for," Sadamori said. "Once the oil price goes to certain levels, this will stimulate new drilling and investments in North America," he added.
|

October, 20, 12:30:00
OIL & GAS WILL CRUTIALOGJ - Oil and gas will remain crucial energy components as their share of the total global mix falls from 53% now to 43% in 2050, Torstad said during a presentation at the National Press Club sponsored by the US Energy Association. “We’ve assumed a generally steady change toward 2050, with less crude oil production but more natural gas and electricity, where solar and wind power will grow because of cost reductions,” she said.
|

October, 16, 12:20:00
WORLD OIL DEMAND UP BY 1.5 MBDWorld oil demand growth in 2017 is now expected to increase by 1.5 mb/d, representing an upward revision of around 30 tb/d from last previous report, mainly reflecting recent data showing an improvement in economic activities. Positive revisions were primarily a result of higher-than-expected oil demand from the OECD region and China. In 2018, world oil demand is anticipated to grow by 1.4 mb/d, following an upward adjustment of 30 tb/d over the previous report, due to the improving economic outlook in the world economy, particularly China and Russia.
|

September, 15, 08:55:00
WORLD ENERGY CONSUMPTION UP TO 28%The U.S. Energy Information Administration projects that world energy consumption will grow by 28% between 2015 and 2040. Most of this growth is expected to come from countries that are not in the Organization for Economic Cooperation and Development (OECD), and especially in countries where demand is driven by strong economic growth, particularly in Asia. Non-OECD Asia (which includes China and India) accounts for more than 60% of the world's total increase in energy consumption from 2015 through 2040.
|

September, 13, 15:10:00
IMF: SOUTHEAST ASIA'S TRANSFORMATIONIMF - When we think about Asia’s economic future, we know that this future is being built on strong foundations—on the richness and diversity of its cultures, on the incredible energy and ingenuity of the people who have changed the world by transforming their own economies. China and India have been driving the greatest poverty reduction in human history by creating the world’s largest middle classes. In a single generation, Vietnam has moved from being one of the world’s poorest nations to being a middle-income country.
|

July, 12, 14:10:00
IEA: ENERGY INVESTMENT UPDOWNTotal energy investment worldwide in 2016 was just over $1.7 trillion, accounting for 2.2% of global GDP. Investment was down by 12% compared to IEA’s revised 2015 energy investment estimate of $1.9 trillion. |


