2017-09-22 08:55:00
U.S. OIL & CASH FLOW UP
EIA - Second-quarter 2017 financial statements for 55 U.S. oil companies indicate that aggregate liquids production grew year over year for the first time since the fourth quarter of 2015. Cash flow from operating activities also increased year over year, the third consecutive quarter of year-over-year growth, reaching the highest level in nearly two years. These companies' ability to sufficiently meet financial obligations and their increased hedging activity, which locks in prices for their future production, suggest that production could continue growing in the coming quarters.
The 55 companies included in the analysis are listed on U.S. stock exchanges and must submit financial reports to the U.S. Securities and Exchange Commission. They operate largely in U.S. onshore basins, but some also operate in the Federal Offshore Gulf of Mexico, Alaska, and various other regions across the globe.
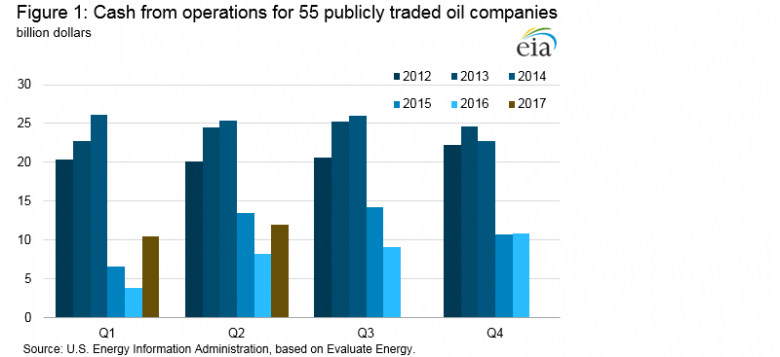
Cash from operations for these 55 companies totaled $11.9 billion in the second quarter of 2017, $3.8 billion higher than the same period in 2016 and the highest level for any quarter since the third quarter of 2015 (Figure 1). Higher crude oil prices and production contributed to the increase in cash from operations. West Texas Intermediate (WTI) front-month futures prices averaged $48.15 per barrel (b) in the second quarter of 2017, $2.51/b higher than in the second quarter of 2016.
Total liquids production for the 55 companies averaged 5.3 million barrels per day (b/d), a 1% increase compared with the second quarter of 2016 and the first annual increase in production since the fourth quarter of 2015. Since the beginning of 2017, more than two-thirds of these companies increased their capital expenditures, investing in drilling and completing wells that contributed to the production growth in the second quarter of 2017 (Figure 2). Capital expenditures for these companies increased 37% year over year in the second quarter of 2017, totaling $14.5 billion.

Activity in the WTI crude oil futures market suggests that some U.S. producers will continue to increase capital expenditures and liquids production. Short positions in WTI crude oil futures contracts held by producers and merchants have declined since the beginning of 2017, but they remain elevated compared with previous years. Short positions held by swap dealers—entities that hedge futures on behalf of oil companies—reached a three-year high of 475,000 contracts in August (Figure 3). Initiating a short position, or selling a futures contract, allows the holder to lock in a future price for a commodity today, which oil producers and end users can use as a way to hedge, or mitigate, price risk.

In addition to hedging, other indicators from the companies' financial statements suggest that they should be able to maintain, and possibly increase, funding for upstream projects, even without further increases in prices. Almost half of these companies have enough cash and other short-term assets to cover their financial obligations due within the next year, generally considered a suitable amount of liquidity (Figure 4).

The median ratio of short-term assets to short-term liabilities declined over the past year as companies used cash to increase capital expenditures. Higher crude oil prices in 2017 compared with 2016 also suggest that companies that borrow based on the value of their proved reserves should be able to maintain or increase their access to short-term financing. Third-quarter 2017 results will be released in November.
-----
Earlier:
|
September, 20, 08:50:00 U.S. OIL + 79 TBD, GAS + 788 MCFDCrude oil output from the seven major US onshore producing regions is forecast to increase 79,000 b/d month-over-month in October to 6.083 million b/d. Natural gas production from the seven regions is expected to climb 788 MMcfd month-over-month in October to 59.745 bcfd. |
|
September, 20, 08:30:00 U.S. DEFICIT UP TO $123.1 BLNThe U.S. current-account deficit increased to $123.1 billion (preliminary) in the second quarter of 2017 from $113.5 billion (revised) in the first quarter of 2017, according to statistics released by the Bureau of Economic Analysis (BEA). The deficit increased to 2.6 percent of current-dollar gross domestic product (GDP) from 2.4 percent in the first quarter. |
|
September, 18, 12:05:00 U.S. RIGS DOWN 8 TO 936U.S. Rig Count is up 430 rigs from last year's count of 506, with oil rigs up 333, gas rigs up 97, and miscellaneous rigs unchanged at 1. Canada Rig Count is up 80 rigs from last year's count of 132, with oil rigs up 37, gas rigs up 44, and miscellaneous rigs down 1. |
|
September, 8, 09:00:00 U.S. ENERGY INVESTMENT: $1.3 TLN“We welcome the President’s commitment to pro-growth tax reform, and look forward to working with the administration and Congress on continuing our nation’s energy leadership. Pro-growth tax reform and economic policies can further strengthen our energy infrastructure and benefit consumers. As an industry that invests billions in the U.S. economy each year, pro-growth policies would allow us to accelerate these economic investments while keeping energy affordable. Private investment in our nation’s energy infrastructure could exceed $1.3 trillion and support 1 million jobs annually through 2035.” |
|
September, 8, 08:40:00 U.S. DEFICIT $43.7 BLNThe U.S. Census Bureau and the U.S. Bureau of Economic Analysis, through the Department of Commerce, announced today that the goods and services deficit was $43.7 billion in July, up $0.1 billion from $43.5 billion in June, revised. July exports were $194.4 billion, $0.6 billion less than June exports. July imports were $238.1 billion, $0.4 billion less than June imports. |
|
August, 31, 12:15:00 U.S. LNG FOR EUROPE - 4Last week, U.S. liquefied natural gas (LNG) made its way to the somewhat unlikely market of Lithuania. The former Soviet republic traditionally bought its gas from Russian state company Gazprom; this was its first shipment from the United States. For President Donald Trump, that must have been a gratifying sign of the success of his administration’s nascent energy diplomacy. |
|
August, 17, 15:20:00 U.S. OIL INVENTORIES DOWN 9MBU.S. commercial crude oil inventories, excluding the Strategic Petroleum Reserve, decreased by 8.9 million bbl for the week ended Aug. 11 compared with the previous week, the Energy Information Administration said in its weekly oil and products inventory report. |


