2018-05-23 10:40:00
U.S. THE WORLD'S TOP
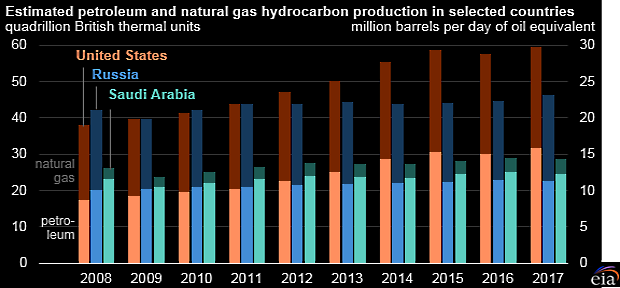
EIA - The United States remained the world's top producer of petroleum and natural gas hydrocarbons in 2017, reaching a record high. The United States has been the world's top producer of natural gas since 2009, when U.S. natural gas production surpassed that of Russia, and the world's top producer of petroleum hydrocarbons since 2013, when U.S. production exceeded Saudi Arabia's. Since 2008, U.S. petroleum and natural gas production has increased by nearly 60%.
For the United States and Russia, total petroleum and natural gas hydrocarbon production, measured in energy content, is almost evenly split between petroleum and natural gas, while Saudi Arabia's production heavily favors petroleum. Total petroleum production is made up of several different types of liquid fuels, including crude oil and lease condensate, tight oil, extra-heavy oil, and bitumen. In addition, various processes produce natural gas plant liquids (NGPL), biofuels, and other liquid fuels, some as a result of refinery processing gain.

U.S. petroleum production increased by 745,000 barrels per day (b/d) in 2017, driven by a 21% increase in oil prices to approximately $65 per barrel. In the United States, crude oil and lease condensate accounted for 60% of total petroleum hydrocarbon production in 2017, and natural gas plant liquids accounted for 24%. Saudi Arabia and Russia have much smaller volumes of natural gas plant liquids, as well as refinery gain and biofuels production, which combined account for most of the remaining share of U.S. petroleum production.
U.S. dry natural gas production grew slowly in early 2017 because of unfavorable economic conditions at that time. Production increased during the last nine months of the year, ultimately leading to a 5.7 billion cubic feet per day (Bcf/d) difference between the first quarter and fourth quarter of 2017. From 2016 to 2017, domestic dry natural gas production increased by 1%, and U.S. liquefied natural gas exports quadrupled. Consumer natural gas demand was mixed, as a result of warmer winter weather compared with 2016 and higher natural gas prices contributing to a 7% decline in natural gas consumption for power generation.

Russian and Saudi natural gas production expanded significantly in 2017, at 8% and 6% year-on-year growth, respectively. In contrast, Russian and Saudi total liquids production fell in 2017 compared with 2016. Saudi Arabia and Russia lowered oil production as part of an agreement by the Organization of the Petroleum Exporting Countries (OPEC) and some non-OPEC producers (including Russia) to reduce total crude oil production in an effort to lower global oil inventories.
Saudi Arabia's petroleum production is critical to the Saudi economy, but it is specifically important as a source of domestic energy because the country burned nearly 0.5 million b/d of crude oil for electricity generation in 2017. The continued development of the Wasit, Hasbah, and Arabiyah natural gas fields is expected to reduce the country's long-term reliance on power generation from crude oil.
U.S. petroleum and other liquid fuels production is expected to increase, reaching 17.6 million b/d in 2018 and 19.1 million b/d in 2019, up from 15.6 million b/d in 2017.
Russian liquid fuels production to average 11.2 million b/d in 2018 and in 2019, the same as the 2017 production level.
Total liquids production for OPEC, which was 39.3 million b/d in 2017, is forecast to be 39.2 million b/d in 2018 and 39.5 million b/d in 2019. This forecast takes into account recent agreements among OPEC member countries, as well as pledges by some non-OPEC producers, such as Russia, to reduce output. However, noncompliance is expected to increase toward the end of 2018.
-----
Earlier:

2018, May, 21, 10:40:00
U.S. PETROLEUM DEMAND UP BY 750 TBDAPI - American Petroleum Institute reported that the first four months of this year saw U.S. petroleum demand average 750 thousand barrels a day above the same period in 2017 despite higher prices, a sign of solid economic activity. April also saw the U.S. produce a record 10.5 million barrels per day (MBD) of oil. |

2018, May, 16, 11:55:00
U.S. OIL PRODUCTION + 144 TBD, GAS PRODUCTION + 1,092 MCFDEIA - Crude oil production from the major US onshore regions is forecast to increase 144,000 b/d month-over-month in June from 7,034 to 7,178 thousand barrels/day , gas production to increase 1,092 million cubic feet/day from 67,027 to 68,119 million cubic feet/day . |

2018, May, 14, 10:30:00
U.S. RIGS UP 13 TO 1,045BAKER HUGHES A GE - U.S. Rig Count is up 13 rigs from last week to 1,045, with oil rigs up 10 to 844, gas rigs up 3 to 199, and miscellaneous rigs unchanged at 2. Canada Rig Count is down 7 rigs from last week to 79, with oil rigs down 5 to 32 and gas rigs down 2 to 47. |

2018, May, 2, 13:15:00
U.S. GAS PRODUCTION UP 10%EIA - In February 2018, for the ninth consecutive month, dry natural gas production increased year-to-year from the same month a year ago. The preliminary level for dry natural gas production in February 2018 was 2,203 billion cubic feet (Bcf), or 78.7 Bcf/day. This level was 7.1 Bcf/day (10.0%) higher than the February 2017 level of 71.5 Bcf/day. The average daily rate of dry natural gas production for February was the highest for the month since EIA began tracking monthly dry production in 1973. |

2018, April, 23, 14:40:00
U.S. OIL DEMAND UP TO 20.6 MBDAPI - the American Petroleum Institute reported that U.S. petroleum demand reached 20.6 million barrels per day (MBD) last month, the highest level since 2007. To satisfy demand, domestic refineries utilized 91.5 percent of their capacity – a record for the month of March – and processed 17 MBD of oil and natural gas liquids (NGLs). The U.S. also produced a record 10.4 MBD of crude oil plus another 3.9 MBD of NGLs. |

2018, April, 20, 09:25:00
U.S. PETROLEUM DRILLING UP 35%API - natural gas and oil drilling and completions rose more than 35 percent over 2017 levels signaling the strength of the U.S. natural gas and oil industry. In addition, the success rate for exploration of natural gas and oil was more than 60 percent, the highest rate since 2009.
|

2018, April, 16, 09:15:00
U.S. GAS INVESTMENT: $170 BLNBLOOMBERG - Gas output will expand by 24 billion cubic feet, or 32 percent, through 2025 from last year, according to U.S. Energy Information Administration estimates. To support that growth, the country’s gas industry needs to spend $170 billion over the next seven years on pipelines, compressor stations, export terminals and other related infrastructure, said Meg Gentle, chief executive officer of gas exporter Tellurian Inc. |


