2018-06-13 13:10:00
OIL PRICES: 2018 - $71, 2019 - $68
EIA - SHORT-TERM ENERGY OUTLOOK
Prices

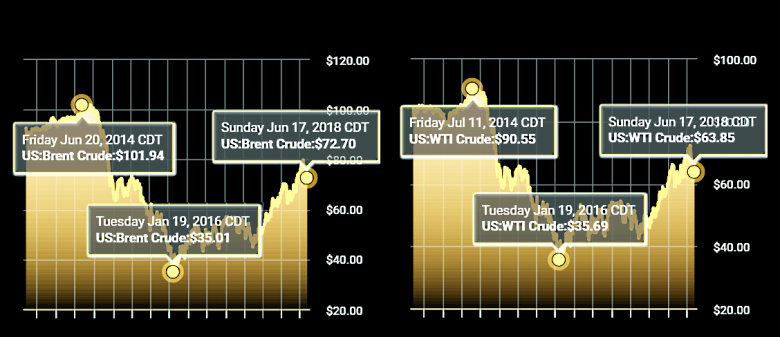
Brent crude oil spot prices averaged $77 per barrel (b) in May, an increase of $5/b from the April level and the highest monthly average price since November 2014. EIA forecasts Brent spot prices will average $71/b in 2018 and $68/b in 2019. The 2019 forecast price is $2/b higher than in the May STEO. EIA expects West Texas Intermediate (WTI) crude oil prices will average almost $7/b lower than Brent prices in 2018 and $6/b lower than Brent prices in 2019. NYMEX WTI futures and options contract values for September 2018 delivery traded during the five-day period ending June 7, 2018, suggest a range of $52/b to $81/b encompasses the market expectation for September WTI prices at the 95% confidence level.

EIA expects Henry Hub natural gas spot prices to average $2.99/million British thermal units (MMBtu) in 2018 and $3.08/MMBtu in 2019. NYMEX futures and options contract values for September 2018 delivery that traded during the five-day period ending June 7, 2018, suggest that a range of $2.38/MMBtu to $3.57/MMBtu encompasses the market expectation for September Henry Hub natural gas prices at the 95% confidence level.
Global Liquid Fuels
EIA estimates that U.S. crude oil production averaged 10.7 million barrels per day (b/d) in May, up 80,000 b/d from the April level. EIA projects that U.S. crude oil production will average 10.8 million b/d in 2018, up from 9.4 million b/d in 2017, and will average 11.8 million b/d in 2019.

EIA forecasts that total U.S. crude oil and petroleum product net imports will fall from an annual average of 3.7 million b/d in 2017 to an average of 2.5 million b/d in 2018 and to 1.6 million b/d in 2019, which would be the lowest level of net oil imports since 1959.
EIA forecasts crude oil production from the Organization of the Petroleum Exporting Countries (OPEC) will average 32.0 million b/d in 2018, a decrease of 0.4 million b/d from the 2017 level. OPEC crude oil production is expected to increase slightly to an average of 32.1 million b/d in 2019. The increase in production in 2019 is expected to occur despite falling production in Venezuela and Iran. EIA assumes these decreases will be offset by increasing production from Persian Gulf producers, primarily Saudi Arabia.
Natural Gas
U.S. dry natural gas production averaged 73.6 billion cubic feet per day (Bcf/d) in 2017. EIA forecasts dry natural gas production will average 81.2 Bcf/d in 2018, establishing a new record. EIA expects natural gas production will rise again in 2019 to 83.8 Bcf/d.

Growing forecast U.S. natural gas production supports increasing forecast liquefied natural gas (LNG) exports. LNG exports averaged 1.9 Bcf/d in 2017. EIA forecasts LNG exports to average 3.0 Bcf/d in 2018 and 5.1 Bcf/d in 2019. Dominion Energy's Cove Point LNG facility is ramping up exports. In April, the facility exported an estimated 13.4 Bcf, implying baseload utilization of 65%, and in May, it exported an estimated 23.5 Bcf, implying baseload utilization of 94%.
EIA expects Henry Hub natural gas spot prices to average $2.99/million British thermal units (MMBtu) in 2018 and $3.08/MMBtu in 2019. NYMEX futures and options contract values for September 2018 delivery that traded during the five-day period ending June 7, 2018, suggest that a range of $2.38/MMBtu to $3.57/MMBtu encompasses the market expectation for September Henry Hub natural gas prices at the 95% confidence level.
Coal
EIA forecasts coal production to decline by 2% to 756 million short tons (MMst) in 2018. The production decrease is largely attributable to a forecast decline of 5% in domestic coal consumption in 2018, with most of the decline is expected to be in the electric power sector. A forecast decline of 4% in coal exports also contributes to lower expected coal production in 2018. EIA expects coal production to decline by 2% in 2019.
Electricity
EIA expects the share of U.S. total utility-scale electricity generation from natural gas-fired power plants to rise from 32% in 2017 to 34% in 2018 and 2019. The forecast electricity generation share from coal averages 28% in 2018 and 2019, down from 30% in 2017. The nuclear share of generation was 20% in 2017 and is forecast to be 20% in 2018 and 19% in 2019. Nonhydropower renewables provided slightly less than 10% of electricity generation in 2017 and are expected to provide more than 10% in 2018 and nearly 11% in 2019. The generation share of hydropower was 7% in 2017 and is forecast to be about the same in 2018 and 2019.

In 2017, EIA estimates that wind generation averaged 697,000 megawatthours per day (MWh/d). EIA forecasts that wind generation will rise to 746,000 MWh/d in 2018 and to 777,000 MWh/d in 2019. If factors such as precipitation and snowpack remain as forecast, conventional hydropower is forecast to generate 752,000 MWh/d in 2019, which would make it the first year that wind generation exceeds hydropower generation in the United States.
Renewables and Carbon Dioxide Emissions
EIA expects the share of U.S. total utility-scale electricity generation from natural gas-fired power plants to rise from 32% in 2017 to 34% in 2018 and 2019. The forecast electricity generation share from coal averages 28% in 2018 and 2019, down from 30% in 2017. The nuclear share of generation was 20% in 2017 and is forecast to be 20% in 2018 and 19% in 2019. Nonhydropower renewables provided slightly less than 10% of electricity generation in 2017 and are expected to provide more than 10% in 2018 and nearly 11% in 2019. The generation share of hydropower was 7% in 2017 and is forecast to be about the same in 2018 and 2019.

In 2017, EIA estimates that wind generation averaged 697,000 megawatthours per day (MWh/d). EIA forecasts that wind generation will rise to 746,000 MWh/d in 2018 and to 777,000 MWh/d in 2019. If factors such as precipitation and snowpack remain as forecast, conventional hydropower is forecast to generate 752,000 MWh/d in 2019, which would make it the first year that wind generation exceeds hydropower generation in the United States.
After declining by 0.9% in 2017, EIA forecasts that energy-related carbon dioxide (CO2) emissions will rise by 1.1% in 2018 and by 0.2% in 2019. Energy-related CO2 emissions are sensitive to changes in weather, economic growth, energy prices, and fuel mix.
-----
Earlier:

2018, June, 15, 11:25:00
OIL PRODUCTION WILL UPREUTERS - Saudi Arabia and Russia, architects of the deal among producers to cut output by about 1.8 million barrels per day (bpd) from January 2017, have now indicated they want output to increase. |

2018, June, 15, 11:10:00
BP: GROWTH IN ENERGY DEMAND UPBP - In 2017 global energy demand grew by 2.2%, above its 10-year average of 1.7%. This above-trend growth was driven by stronger economic growth in the developed world and a slight slowing in the pace of improvement in energy intensity. |

2018, June, 8, 13:20:00
OPEC: WORLD OIL DEMAND UP, PRODUCTION DOWNOPEC - World oil demand averaged 97.20 mb/d in 2017, up by 1.7 per cent y-o-y, with the largest increases taking place in Asia and Pacific region (particularly China and India), Europe and North America. The 2017 oil demand in Africa and the Middle East grew by around 100,000 b/d, as compared to 2016, while oil demand declined in Latin America for the third year in a row. |

2018, June, 8, 13:15:00
OIL DEMAND UP TO 2030PLATTS - Global oil demand will peak around 2030 at 111 million b/d as a sharp rise in electric vehicles and energy efficiency gains offset growing demand from the aviation and petrochemical sectors, Norwegian producer Equinor said
|

2018, June, 6, 12:20:00
OPEC - RUSSIA OPINIONREUTERS - “We have to look into the situation which has panned out on the market today, from the point of view of the volume cuts, inventories decline, shortages on the market, and to adjust the figures,” Novak told reporters. |

2018, June, 1, 09:25:00
U.S. PRODUCTION: OIL 10.474 MBD, GAS 98,323 MCFDEIA - U.S. oil production up to 10.474 MBD, gas production up to 98,323 MCFD
|

2018, May, 30, 13:55:00
GLOBAL INVESTMENT UP, DEBT DOWNEIA - Financial Review of the Global Oil and Natural Gas Industry: 2017 - Brent crude oil daily average prices were $54.75 per barrel in 2017—21% higher than 2016 levels - Excluding proved reserve acquisitions, upstream costs incurred increased from 2016 levels but remained lower than 2008–15 levels - Proved reserves additions in 2017 approached the highest levels in the 2008–17 period - Finding plus lifting costs fell to $29 dollars per barrel of oil equivalent in 2017, the lowest level in the 2008–17 period - The energy companies reduced debt in 2017, the first year in the 2008–17 period - Refiners with global refining assets reduced distillation capacity for the eighth consecutive year |


