2018-06-08 12:50:00
U.S. DEFICIT DOWN TO $46.2 BLN
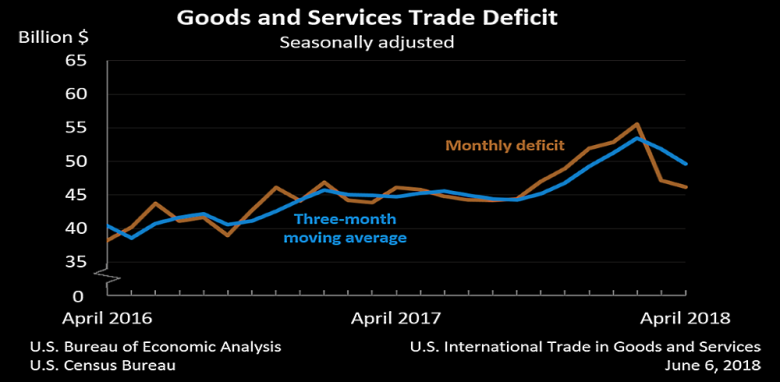
BEA - The U.S. Census Bureau and the U.S. Bureau of Economic Analysis announced today that the goods and services deficit was $46.2 billion in April, down $1.0 billion from $47.2 billion in March, revised.
Exports, Imports, and Balance (exhibit 1)
April exports were $211.2 billion, $0.6 billion more than March exports. April imports were $257.4 billion, $0.4 billion less than March imports.
The April decrease in the goods and services deficit reflected a decrease in the goods deficit of $1.0 billion to $68.3 billion and a decrease in the services surplus of less than $0.1 billion to $22.1 billion.
Year-to-date, the goods and services deficit increased $20.8 billion, or 11.5 percent, from the same period in 2017. Exports increased $62.0 billion or 8.1 percent. Imports increased $82.8 billion or 8.7 percent.
Three-Month Moving Averages (exhibit 2)
The average goods and services deficit decreased $2.2 billion to $49.6 billion for the three months ending in April.
- Average exports increased $2.9 billion to $209.3 billion in April.
- Average imports increased $0.7 billion to $259.0 billion in April.
Year-over-year, the average goods and services deficit increased $4.9 billion from the three months ending in April 2017.
- Average exports increased $17.0 billion from April 2017.
- Average imports increased $21.9 billion from April 2017.
Exports (exhibits 3, 6, and 7)
Exports of goods increased $0.3 billion to $141.2 billion in April.
Exports of goods on a Census basis increased $0.3 billion.
- Industrial supplies and materials increased $1.3 billion.
- Fuel oil increased $0.5 billion.
- Other petroleum products increased $0.2 billion.
- Foods, feeds, and beverages increased $0.7 billion.
- Soybeans increased $0.3 billion.
- Corn increased $0.3 billion.
- Capital goods decreased $1.4 billion.
- Civilian aircraft decreased $2.8 billion.
Net balance of payments adjustments increased less than $0.1 billion.
Exports of services increased $0.3 billion to $70.0 billion in April.
- Other business services, which includes research and development services; professional and management services; and technical, trade-related, and other services, increased $0.1 billion.
- Financial services increased $0.1 billion.
- Charges for the use of intellectual property increased $0.1 billion.
Imports (exhibits 4, 6, and 8)
Imports of goods decreased $0.7 billion to $209.5 billion in April.
Imports of goods on a Census basis decreased $0.9 billion.
- Consumer goods decreased $2.8 billion.
- Cell phones and other household goods decreased $2.2 billion.
- Automotive vehicles, parts, and engines decreased $0.9 billion.
- Passenger cars decreased $1.0 billion.
- Other goods increased $1.3 billion.
- Industrial supplies and materials increased $1.2 billion.
- Crude oil increased $1.0 billion.
Net balance of payments adjustments increased $0.2 billion.
Imports of services increased $0.3 billion to $47.9 billion in April.
- Transport increased $0.1 billion.
- Other business services increased $0.1 billion.
- Charges for the use of intellectual property increased $0.1 billion.
Real Goods in 2012 Dollars – Census Basis (exhibit 11)
The real goods deficit decreased $0.7 billion to $77.5 billion in April.
- Real exports of goods decreased $0.2 billion to $150.6 billion.
- Real imports of goods decreased $0.9 billion to $228.1 billion.
Revisions
Exports and imports of goods and services for all months through March 2018 shown in this release reflect the incorporation of annual revisions to the goods and services series. See the "Notice" in this release for a description of the revisions.
Revisions to March exports
- Exports of goods were revised up $0.1 billion.
- Exports of services were revised up $2.1 billion.
Revisions to March imports
- Imports of goods were revised down $0.1 billion.
- Imports of services were revised up $0.5 billion.
-----
Earlier:

2018, June, 4, 13:45:00
THE DRAMATIC U.S. GOVERNMENTPLATTS - "Japanese companies don't want to stop imports suddenly," he said, adding the US position needed clarifying. "The situation in the US government is drastically changing every day." |

2018, June, 4, 13:25:00
U.S. ENERGY THREATAPI - “The implementation of new tariffs will disrupt the U.S. oil and natural gas industry’s complex supply chain, compromising ongoing and future U.S. energy projects, which could weaken our national security. Additionally, Canada, Mexico and the European Union are imperative members of our Defense Industrial Base (DIB) and are top military allies – far from a threat to America’s security. |

2018, June, 4, 13:20:00
U.S. COAL & NUCLEAR POWERAPI - A diverse group of energy industry associations including energy efficiency and storage, natural gas, oil, solar and wind issued the following statement condemning the Administration’s draft plan to bail out coal and nuclear plants across the country. |

2018, June, 1, 09:10:00
U.S. GDP UP 2.2%BEA - Real gross domestic product (GDP) increased at an annual rate of 2.2 percent in the first quarter of 2018, according to the "second" estimate released by the Bureau of Economic Analysis. In the fourth quarter of 2017, real GDP increased 2.9 percent. |

2018, May, 23, 10:40:00
U.S. THE WORLD'S TOPEIA - The United States remained the world's top producer of petroleum and natural gas hydrocarbons in 2017, reaching a record high. The United States has been the world's top producer of natural gas since 2009, when U.S. natural gas production surpassed that of Russia, and the world's top producer of petroleum hydrocarbons since 2013, when U.S. production exceeded Saudi Arabia’s. Since 2008, U.S. petroleum and natural gas production has increased by nearly 60%. |

2018, May, 23, 10:35:00
U.S. - CHINA ENERGY TRADEPLATTS - China became the largest contributor to global LNG consumption growth in 2017. It surpassed South Korea as the world's second largest LNG importer and its share of global LNG demand is expected to converge with that of Japan by 2030. |

2018, May, 18, 08:40:00
U.S. INDUSTRIAL PRODUCTION UP 0.7%FRB - Industrial production rose 0.7 percent in April for its third consecutive monthly increase. The rates of change for industrial production for previous months were revised downward, on net; for the first quarter, output is now reported to have advanced 2.3 percent at an annual rate. |


