2021-01-21 14:30:00


OECD GAS PRODUCTION DOWN 3.4%
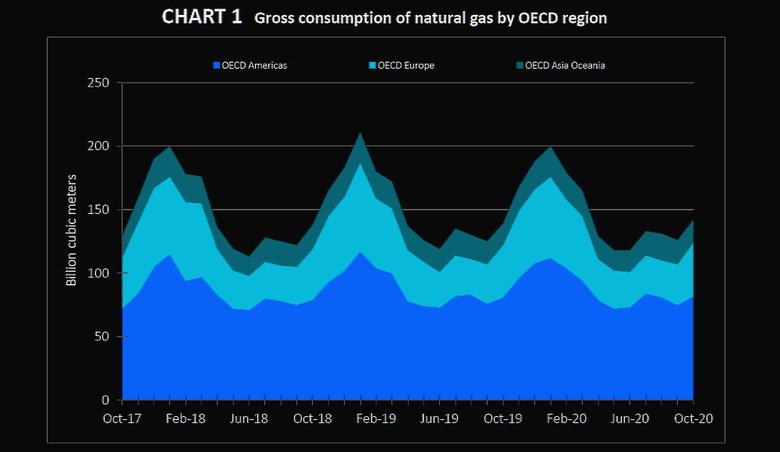
IEA - Jan 19, 2021 - MONTHLY OECD NATURAL GAS STATISTICS, October 2020
Total OECD indigenous production of natural gas decreased by 3.4% in October 2020 compared to October 2019. The negative trend was led by the OECD Americas (-5.8% y-o-y1), followed by OECD Europe (-5.0% y-oy), due mostly to a production declines in the United States (-7.4% y-o-y) and Norway (-4.8% y-o-y).
Meanwhile, production grew by 18.9% in OECD Asia Oceania, where the positive trend was led by Australia (+22.5% y-o-y). Overall, total OECD indigenous production of natural gas decreased by 1.4% on a year-todate basis2.
Total OECD imports (entries)3 of natural gas declined by 1.8% in October 2020 on a year-on-year basis. This trend was led by OECD Europe (-2.6% y-o-y) with a 1.9% y-o-y decrease of imports from OECD countries. The OECD Americas and OECD Asia Oceania balanced each other with a decrease of 4.5% and an increase of 3.4% year-on-year, respectively. In terms of pipeline and LNG split, a decrease was observed for LNG imports (- 7.2% y-o-y) while pipeline imports increased (+0.2% y-o-y) in the total OECD.
Total OECD exports (exits)3 of natural gas increased by 0.3% in October 2020 compared to October 2019. Both the OECD Americas (+7.0% y-o-y) and OECD Asia Oceania (+24.6% y-o-y) experienced increases in exports. Contrarily, a decrease in exports was observed in OECD Europe (-8.1% y-o-y). Total OECD exports of LNG increased by 17.4% y-o-y, while the trend reversed for pipeline exports with a 4.6% decrease y-o-y. Total OECD gross consumption of natural gas increased by 1.4% in October 2020 compared to the same month last year. Year-on-year consumption rose in all three regions: OECD Asia Oceania increased by 5.7%, OECD Europe by 1.2% and the OECD Americas by 0.6%, driven mostly by Australia (+14.8% y-o-y), Turkey (+23.3% y-o-y) and Mexico (+23.0 y-o-y). Overall, total OECD gross consumption of natural gas decreased by 2.1% y-t-d.
1. Year-on-year (y-o-y) change over corresponding month of previous year.
2. Year-to-date (y-t-d) change over corresponding period (beginning of year to current month) of previous year.
3. Transit volumes are included. Trade amounts include intra-regional trade.
-----
Earlier:

2021, January, 20, 14:45:00
NORD STREAM 2 SANCTIONS ANEW
"Today, the US is imposing sanctions on the Russia-based entity KVT-RUS and identifying the vessel Fortuna as blocked property," Pompeo said in a statement.
2021, January, 20, 14:30:00
TURKEY GAS CONSUMPTION RECORD
Natural gas consumption countrywide increased both due to the rapidly falling temperatures and a rise in household gas consumption with time spent at home increased due to COVID-19 pandemic restrictions and lockdowns.
2021, January, 19, 13:50:00
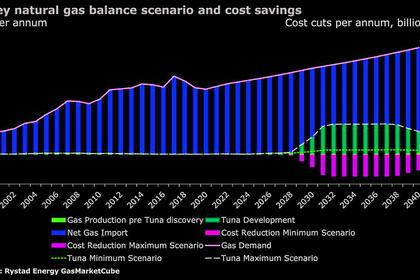
EU GAS MARKETS ARE CHANGING
The European Commission is planning to issue new proposals for gas legislation in the last quarter of 2021. EU gas markets are on the cusp of dramatic changes.
2021, January, 19, 13:45:00
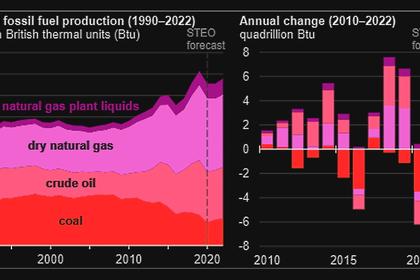
U.S. FOSSIL FUEL WILL UP
U.S. production of all fossil fuels—crude oil, coal, dry natural gas, and natural gas plant liquids (NGPL)—to increase in 2022, but forecast fossil fuel production will remain lower than the 2019 peak.
2021, January, 15, 11:50:00
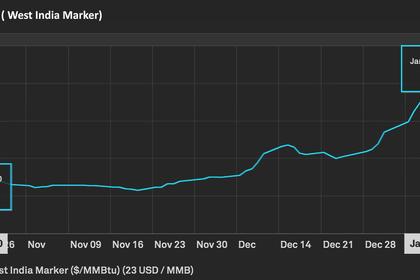
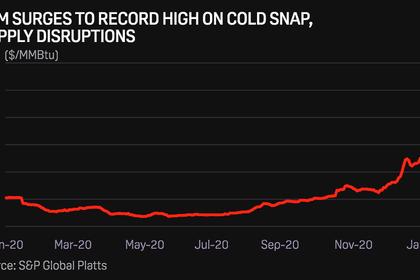
LNG PRICES UP ANEW
Spot LNG prices LNG-AS have nearly tripled since early November as freezing temperatures across North Asia boosted demand and depleted inventories. Since July, prices are up a dizzying 1,000%.
2021, January, 15, 11:40:00
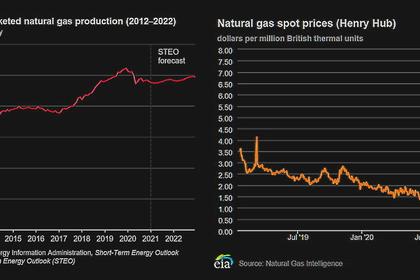
U.S. GAS PRODUCTION UPDOWN
U.S. marketed gas production for 2021 will fall 2% and average 96.2 billion cubic feet per day (Bcf/d).
2021, January, 13, 13:40:00
QATAR LNG EXPANSION
State-owned Qatar Petroleum is planning a to increase LNG production by 43% to 110 million mt/year by 2025, up from 77 million mt/year currently.


