2021-01-11 12:35:00


U.S. EMPLOYMENT DOWN BY 140,000
U.S. BLS - January 8, 2021 - THE EMPLOYMENT SITUATION -- DECEMBER 2020
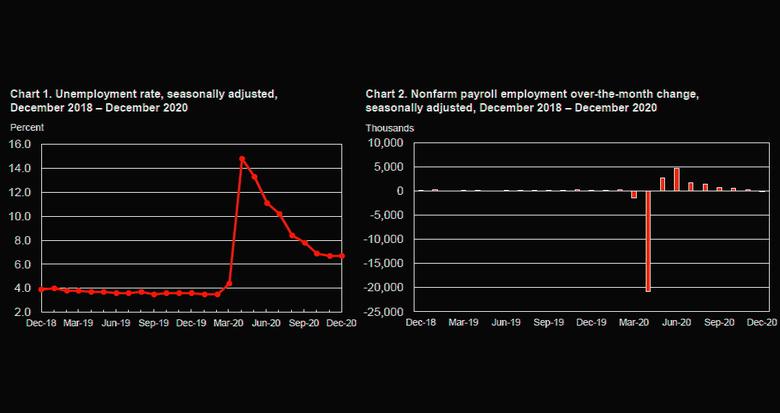
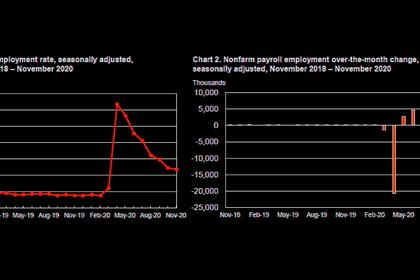
Total nonfarm payroll employment declined by 140,000 in December, and the unemployment rate was unchanged at 6.7 percent, the U.S. Bureau of Labor Statistics reported today. The decline in payroll employment reflects the recent increase in coronavirus (COVID-19) cases and efforts to contain the pandemic. In December, job losses in leisure and hospitality and in private education were partially offset by gains in professional and business services, retail trade, and construction.
This news release presents statistics from two monthly surveys. The household survey measures labor force status, including unemployment, by demographic characteristics. The establishment survey measures nonfarm employment, hours, and earnings by industry. For more information about the concepts and statistical methodology used in these two surveys, see the Technical Note.
Household Survey Data
In December, both the unemployment rate, at 6.7 percent, and the number of unemployed persons, at 10.7 million, were unchanged. Although both measures are much lower than their April highs, they are nearly twice their pre-pandemic levels in February (3.5 percent and 5.7 million, respectively). (See table A-1. For more information about how the household survey and its measures were affected by the coronavirus pandemic, see the box note at the end of this news release.)
Among the major worker groups, the unemployment rates for teenagers (16.0 percent) and Hispanics (9.3 percent) increased in December. The jobless rates for adult men (6.4 percent), adult women (6.3 percent), Whites (6.0 percent), Blacks (9.9 percent), and Asians (5.9 percent) showed little change. (See tables A-1, A-2, and A-3.)
Among the unemployed, the number of persons on temporary layoff increased by 277,000 in December to 3.0 million. This measure is down considerably from the high of 18.0 million in April but is 2.3 million higher than in February. The number of permanent job losers declined by 348,000 to 3.4 million in December but is up by 2.1 million since February.
The number of unemployed reentrants increased by 282,000 to 2.3 million over the month, 452,000 higher than in February. (See table A-11.)
In December, the number of persons jobless less than 5 weeks increased by 449,000 to 2.9 million, while the number of persons jobless 15 to 26 weeks declined by 303,000 to 1.6 million. The number of long-term unemployed (those jobless for 27 weeks or more), at 4.0 million, was essentially unchanged in December but has increased by 2.8 million since February. The number of those jobless for 27 weeks or more accounted for 37.1 percent of total unemployed in December. (See table A-12.)
The labor force participation rate and the employment-population ratio were both unchanged over the month, at 61.5 percent and 57.4 percent, respectively. These measures are up from their recent April lows but are lower than in February by 1.8 percentage points and 3.7 percentage points, respectively. (See table A-1.)
The number of persons employed part time for economic reasons, at 6.2 million, decreased by 471,000 over the month. This measure is down from its April high of 10.9 million but is 1.8 million higher than the February level. These individuals, who would have preferred full-time employment, were working part time because their hours had been reduced or they were unable to find full-time jobs. (See table A-8.)
In December, the number of persons not in the labor force who currently want a job, at 7.3 million, was little changed over the month but is 2.3 million higher than in February. These individuals were not counted as unemployed because they were not actively looking for work during the last 4 weeks or were unavailable to take a job. (See table A-1.)
Among those not in the labor force who currently want a job, the number of persons marginally attached to the labor force, at 2.2 million, changed little in December but is up by 749,000 since February. These individuals wanted and were available for work and had looked for a job sometime in the prior 12 months but had not looked for work in the 4 weeks preceding the survey. The number of discouraged workers, a subset of the marginally attached who believed that no jobs were available for them, was essentially unchanged at 663,000 in December but is up by 262,000 since February. (See Summary table A.)
Household Survey Supplemental Data
In December, 23.7 percent of employed persons teleworked because of the coronavirus pandemic, up from 21.8 percent in November. These data refer to employed persons who teleworked or worked at home for pay at some point in the last 4 weeks specifically because of the pandemic.
In December, 15.8 million persons reported that they had been unable to work because their employer closed or lost business due to the pandemic--that is, they did not work at all or worked fewer hours at some point in the last 4 weeks due to the pandemic.
This measure is 1.0 million higher than in November. Among those who reported in December that they were unable to work because of pandemic-related closures or lost business, 12.8 percent received at least some pay from their employer for the hours not worked, little changed from November.
Among those not in the labor force in December, 4.6 million persons were prevented from looking for work due to the pandemic. This measure is up from 3.9 million in November. (To be counted as unemployed, by definition, individuals must be either actively looking for work or on temporary layoff.)
These supplemental data come from questions added to the household survey beginning in May to help gauge the effects of the pandemic on the labor market. The data are not seasonally adjusted. Tables with estimates from the supplemental questions for all months are available online at www.bls.gov/cps/effects-of-the-coronavirus-covid-19-pandemic.htm.
Establishment Survey Data
Total nonfarm payroll employment declined by 140,000 in December. Employment declines in leisure and hospitality, private education, and government were partially offset by gains in professional and business services, retail trade, construction, and transportation and warehousing. In December, nonfarm employment was below its February level by 9.8 million, or 6.5 percent. (See table B-1. For more information about how the establishment survey and its measures were affected by the coronavirus pandemic, see the box note at the end of this news release.)
In December, employment in leisure and hospitality declined by 498,000, with three- quarters of the decrease in food services and drinking places (-372,000). Employment also fell in the amusements, gambling, and recreation industry (-92,000) and in the accommodation industry (-24,000). Since February, employment in leisure and hospitality is down by 3.9 million, or 23.2 percent.
Employment in private education decreased by 63,000 in December. Employment in the industry is down by 450,000 since February.
Government employment declined by 45,000 in December. Employment in the component of local government that excludes education declined by 32,000, and state government education lost 20,000 jobs. Federal government employment increased by 6,000. Since February, government employment overall is down by 1.3 million.
Other services lost 22,000 jobs in December, with over half of the loss in personal and laundry services (-12,000). Employment in the other services industry is down by 453,000 since February.
In December, employment in professional and business services increased by 161,000, with a large gain in temporary help services (+68,000). Job growth also occurred in computer systems design and related services (+20,000), other professional and technical services (+11,000), management of companies and enterprises (+11,000), and business support services (+7,000). Employment in professional and business services is down by 858,000 since February.
Retail trade added 121,000 jobs in December, with nearly half of the growth occurring in the component of general merchandise stores that includes warehouse clubs and supercenters (+59,000). Job gains also occurred in nonstore retailers (+14,000), automobile dealers (+13,000), health and personal care stores (+10,000), and food and beverage stores (+8,000). Employment in retail trade is 411,000 lower than in February.
Construction added 51,000 jobs in December, but employment in the industry is 226,000 below its February level. In December, employment rose in residential specialty trade contractors (+14,000) and residential building (+9,000), two industries that have gained back the jobs lost in March and April. In December, employment also increased in nonresidential specialty trade contractors (+18,000) and in heavy and civil engineering construction (+15,000).
Employment in transportation and warehousing rose by 47,000 in December, largely in couriers and messengers (+37,000). While employment in transportation and warehousing overall is 89,000 lower than in February, employment in couriers and messengers has increased by 222,000 over the same period. In December, employment also grew in warehousing and storage (+8,000) and in truck transportation (+7,000), while transit and ground passenger transportation lost 9,000 jobs.
In December, health care added 39,000 jobs. Employment growth in hospitals (+32,000) and ambulatory health care services (+21,000) was partially offset by declines in nursing care facilities (-6,000) and community care facilities for the elderly (-5,000).
Health care employment is 502,000 lower than in February.
In December, manufacturing employment increased by 38,000, with gains in motor vehicles and parts (+7,000), plastics and rubber products (+7,000), and nonmetallic mineral products (+6,000). By contrast, miscellaneous nondurable goods manufacturing lost 11,000 jobs over the month. Despite gains over the past 8 months, employment in manufacturing is 543,000 below its February level.
Wholesale trade employment rose by 25,000 in December but is down by 251,000 since February. In December, job gains occurred in durable goods (+11,000) and nondurable goods (+11,000).
In December, employment changed little in other major industries, including mining, information, and financial activities.
In December, average hourly earnings for all employees on private nonfarm payrolls increased by 23 cents to $29.81. Average hourly earnings of private-sector production and nonsupervisory employees increased by 20 cents to $25.09. These increases largely reflect the disproportionate number of lower-paid workers in leisure and hospitality who went off payrolls, which put upward pressure on the average hourly earnings estimates. (See tables B-3 and B-8.)
The average workweek for all employees on private nonfarm payrolls declined by 0.1 hour to 34.7 hours in December. In manufacturing, the workweek was unchanged at 40.2 hours, and overtime increased by 0.1 hour to 3.3 hours. The average workweek for production and nonsupervisory employees on private nonfarm payrolls was unchanged at 34.2 hours. (See tables B-2 and B-7.)
The change in total nonfarm payroll employment for October was revised up by 44,000, from +610,000 to +654,000, and the change for November was revised up by 91,000, from +245,000 to +336,000. With these revisions, employment in October and November combined was 135,000 more than previously reported. (Monthly revisions result from additional reports received from businesses and government agencies since the last published estimates and from the recalculation of seasonal factors.)
-----
Earlier:
2021, January, 8, 15:15:00
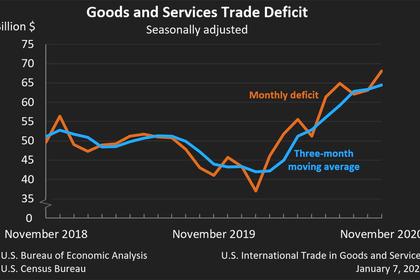
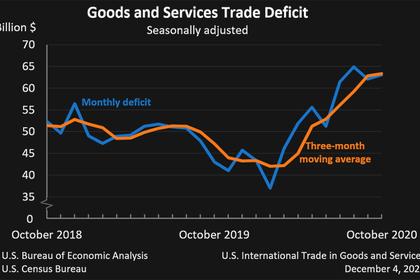
U.S. INTERNATIONAL TRADE DEFICIT UP TO $68 BLN
the U.S. goods and services deficit was $68.1 billion in November, up $5.0 billion from $63.1 billion in October
2020, December, 23, 12:50:00
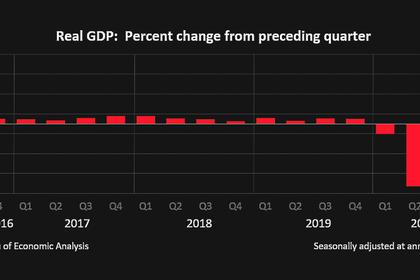
U.S. GDP UP 33.4%
U.S. real gross domestic product (GDP) increased at an annual rate of 33.4 percent in the third quarter of 2020
2020, December, 21, 12:35:00
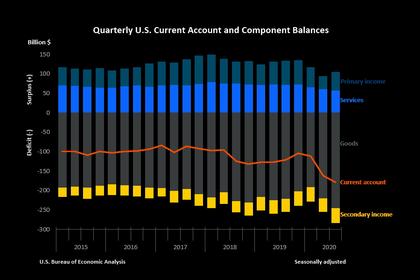
U.S. CURRENT ACCOUNT DEFICIT UP TO $178.5 BLN
The U.S. current account deficit, which reflects the combined balances on trade in goods and services and income flows between U.S. residents and residents of other countries, widened by $17.2 billion, or 10.6 percent, to $178.5 billion in the third quarter of 2020
2020, December, 17, 13:40:00
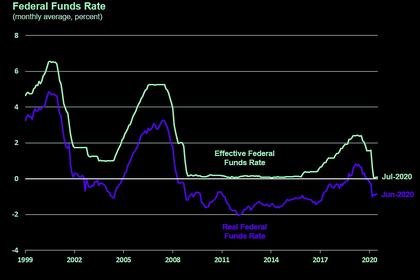
U.S. FEDERAL FUNDS RATE 0.0 - 0.25% AGAIN
The Committee decided to keep the target range for the federal funds rate at 0 to 1/4 percent
2020, December, 16, 12:20:00
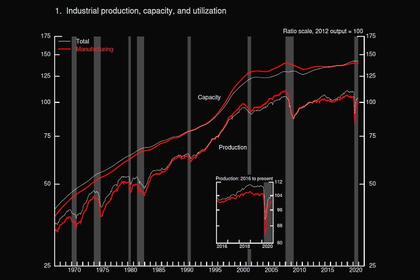
U.S. INDUSTRIAL PRODUCTION INCREASED
U.S. industrial production increased 0.4 percent in November.
2020, December, 8, 12:40:00
U.S. EMPLOYMENT UP BY 245,000
Total nonfarm payroll employment rose by 245,000 in November, and the unemployment rate edged down to 6.7 percent,
2020, December, 7, 13:05:00
U.S. INTERNATIONAL TRADE DEFICIT UP TO $63 BLN
the U.S. goods and services deficit was $63.1 billion in October, up $1.0 billion from $62.1 billion in September


