2021-08-06 11:20:00


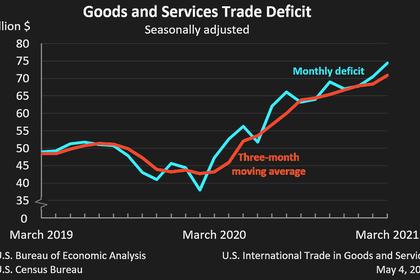
U.S. INTERNATIONAL TRADE DEFICIT UP TO $75.7 BLN
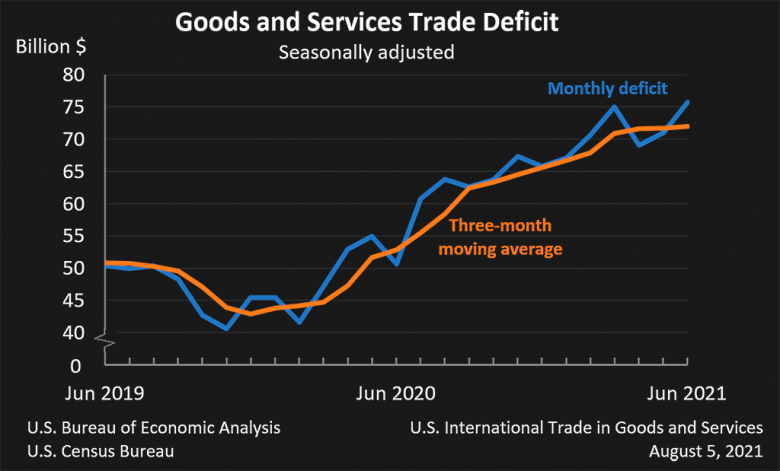
U.S. BEA - August 5, 2021- The U.S. Census Bureau and the U.S. Bureau of Economic Analysis announced today that the goods and services deficit was $75.7 billion in June, up $4.8 billion from $71.0 billion in May, revised.
| Deficit: |
$75.7 Billion |
+6.7%° |
| Exports: |
$207.7 Billion |
+0.6%° |
| Imports: |
$283.4 Billion |
+2.1%° |
|
Next release: Thursday, September 2, 2021 (°) Statistical significance is not applicable or not measurable. Data adjusted for seasonality but not price changes Source: U.S. Census Bureau, U.S. Bureau of Economic Analysis; U.S. International Trade in Goods and Services, August 5, 2021 |
||
Exports, Imports, and Balance (exhibit 1)
June exports were $207.7 billion, $1.2 billion more than May exports. June imports were $283.4 billion, $6.0 billion more than May imports.
The June increase in the goods and services deficit reflected an increase in the goods deficit of $4.0 billion to $93.2 billion and a decrease in the services surplus of $0.7 billion to $17.4 billion.
Year-to-date, the goods and services deficit increased $135.8 billion, or 46.4 percent, from the same period in 2020. Exports increased $150.9 billion or 14.3 percent. Imports increased $286.7 billion or 21.3 percent.
Three-Month Moving Averages (exhibit 2)
The average goods and services deficit increased $0.2 billion to $71.9 billion for the three months ending in June.
- Average exports increased $1.7 billion to $206.3 billion in June.
- Average imports increased $1.9 billion to $278.2 billion in June.
Year-over-year, the average goods and services deficit increased $19.1 billion from the three months ending in June 2020.
- Average exports increased $54.6 billion from June 2020.
- Average imports increased $73.7 billion from June 2020.
Exports (exhibits 3, 6, and 7)
Exports of goods increased $0.3 billion to $145.9 billion in June.
Exports of goods on a Census basis increased $0.2 billion.
- Industrial supplies and materials increased $1.2 billion.
- Crude oil increased $1.6 billion.
- Foods, feeds, and beverages decreased $1.2 billion.
- Soybeans decreased $0.5 billion.
Net balance of payments adjustments increased less than $0.1 billion.
Exports of services increased $0.9 billion to $61.8 billion in June.
- Travel increased $0.4 billion.
- Transport increased $0.2 billion.
Imports (exhibits 4, 6, and 8)
Imports of goods increased $4.3 billion to $239.1 billion in June.
Imports of goods on a Census basis increased $4.2 billion.
- Industrial supplies and materials increased $4.6 billion.
- Nonmonetary gold increased $1.2 billion.
- Finished metal shapes increased $0.5 billion.
- Iron and steel mill products increased $0.4 billion.
- Organic chemicals increased $0.4 billion.
- Capital goods increased $0.8 billion.
- Consumer goods decreased $1.6 billion.
- Pharmaceutical preparations decreased $0.8 billion.
- Cotton apparel and household goods decreased $0.7 billion.
- Automotive vehicles, parts, and engines decreased $0.7 billion.
Net balance of payments adjustments increased $0.1 billion.
Imports of services increased $1.6 billion to $44.3 billion in June.
- Transport increased $1.0 billion.
- Travel increased $0.6 billion.
Real Goods in 2012 Dollars – Census Basis (exhibit 11)
The real goods deficit increased $3.6 billion to $105.2 billion in June.
- Real exports of goods decreased $1.1 billion to $144.0 billion.
- Real imports of goods increased $2.5 billion to $249.2 billion.
Revisions
Revisions to May exports
- Exports of goods were revised up $0.1 billion.
- Exports of services were revised up $0.3 billion.
Revisions to May imports
- Imports of goods were revised up $0.1 billion.
- Imports of services were revised up $0.1 billion.
Goods by Selected Countries and Areas: Monthly – Census Basis (exhibit 19)
The June figures show surpluses, in billions of dollars, with South and Central America ($4.5), Hong Kong ($1.7), Brazil ($1.5), and Singapore ($0.6). Deficits were recorded, in billions of dollars, with China ($27.0), European Union ($19.6), Mexico ($7.2), Germany ($6.3), Canada ($5.5), Japan ($4.9), Italy ($3.7), India ($3.5), Taiwan ($3.3), South Korea ($2.8), France ($1.9), Saudi Arabia ($0.3), and United Kingdom (less than $0.1).
- The deficit with the European Union increased $1.1 billion to $19.6 billion in June. Exports increased $0.6 billion to $22.6 billion and imports increased $1.7 billion to $42.2 billion.
- The deficit with India increased $1.0 billion to $3.5 billion in June. Exports decreased $0.3 billion to $2.9 billion and imports increased $0.7 billion to $6.5 billion.
- The deficit with Japan decreased $0.9 billion to $4.9 billion in June. Exports increased less than $0.1 billion to $6.4 billion and imports decreased $0.9 billion to $11.4 billion.
-----
Earlier:
2021, August, 2, 12:20:00
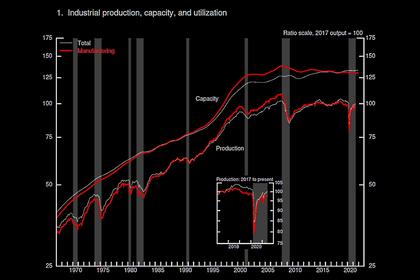
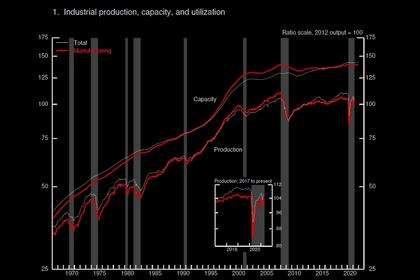
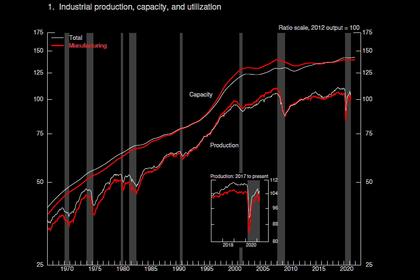
U.S. INDUSTRIAL PRODUCTION UP 0.4%
Industrial production increased 0.4 percent in June after moving up 0.7 percent in May.
2021, July, 29, 13:25:00
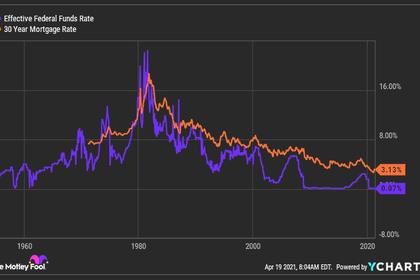
U.S. FEDERAL FUNDS RATE 0.0 - 0.25% ANEW
The Committee decided to keep the target range for the federal funds rate at 0 to 1/4 percent and expects it will be appropriate to maintain this target range until labor market conditions have reached levels consistent with the Committee's assessments of maximum employment and inflation has risen to 2 percent and is on track to moderately exceed 2 percent for some time.
2021, July, 5, 12:50:00
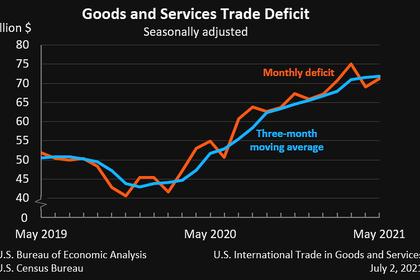
U.S. INTERNATIONAL TRADE DEFICIT UP TO $71.2 BLN
The U.S. goods and services deficit was $71.2 billion in May, up $2.2 billion from $69.1 billion in April
2021, June, 17, 12:20:00
U.S. FEDERAL FUNDS RATE 0.0 - 0.25% YET
The Committee decided to keep the target range for the federal funds rate at 0 to 1/4 percent
2021, May, 19, 14:25:00
U.S. INDUSTRIAL PRODUCTION UP 0.7%
Total industrial production increased 0.7 percent in April. The indexes for mining and utilities increased 0.7 percent and 2.6 percent, respectively; the index for manufacturing rose 0.4 percent despite a drop in motor vehicle assemblies that principally resulted from shortages of semiconductors.
2021, May, 13, 17:15:00
U.S. INTERNATIONAL TRADE DEFICIT UP TO $74.4 BLN
The U.S. goods and services deficit was $74.4 billion in March, up $3.9 billion from $70.5 billion in February
2021, April, 16, 11:45:00
U.S. INDUSTRIAL PRODUCTION UP 1.4%
U.S. industrial production increased 1.4 percent in Murch.


