All publications by tag «PETROLEUM»
2018, March, 16, 10:15:00
U.S. PETROLEUM DEMAND: 20.3 MBD
API - Led by gasoline and seasonal demand for heating fuels, U.S. petroleum demand hit 20.3 million barrels per day (MBD) in February. Demand was up by more than a million barrels per day from February of last year, nearing record highs not seen for more than a decade.

2018, March, 4, 11:10:00
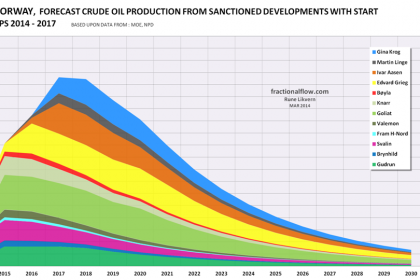
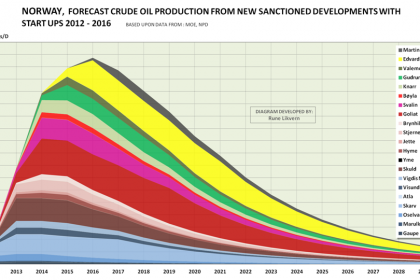
NORWAY'S PETROLEUM RESOURCES: 15.6 BLN M3
NPD - The Norwegian Petroleum Directorate’s (NPD’s) estimate for total proven and unproven petroleum resources on the Norwegian continental shelf is about 15.6 billion standard cubic metres of oil equivalents.
2018, January, 29, 08:40:00
U.S. PETROLEUM DELIVERIES: 20.7 MBD
API - Total petroleum deliveries in December rose to 20.7 million barrels per day. This was the strongest December monthly demand in the last decade.

2017, December, 20, 19:30:00
U.S. PETROLEUM DELIVERIES UP TO 19.9 MBD
API - Total petroleum deliveries in November rose to 19.9 million barrels per day. This was the strongest November monthly demand since 2007. Cumulatively through the first 11 months of the 2017, total domestic petroleum deliveries rose by 0.9 percent, which exceeded demand growth in 2016 despite higher prices.
2017, November, 20, 09:10:00
U.S. PETROLEUM DEMAND UP TO 19.9 MBD
API - Total petroleum deliveries in October moved up by 1.1 percent from October 2016 to average 19.9 million barrels per day. These were the highest October deliveries in 10 years, since 2007. Compared with September, total domestic petroleum deliveries, a measure of U.S. petroleum demand, decreased 1.8 percent. For year-to-date, total domestic petroleum deliveries moved up 1.2 percent compared to the same period last year.
2017, September, 15, 08:30:00
NORWAY'S OIL PRODUCTION DOWN 41 TBD
Preliminary production figures for August 2017 show an average daily production of 1 918 000 barrels of oil, NGL and condensate, which is a decrease of 41 000 barrels per day compared to July.
Total gas sales were 10.4 billion Sm3 (GSm3), which is a decrease of 0.1 GSM3 from the previous month.
2017, August, 24, 13:45:00
NORWAY'S PETROLEUM PRODUCTION UP TO 93 TBD
Preliminary production figures for July 2017 show an average daily production of 2 000 000 barrels of oil, NGL and condensate, which is an increase of 93 000 barrels per day compared to June.
2017, July, 14, 09:30:00
NORWAY'S PRODUCTION DOWN 116 TBD
Preliminary production figures for June 2017 show an average daily production of 1 884 000 barrels of oil, NGL and condensate, which is a decrease of 116 000 barrels per day compared to May.
2017, May, 19, 12:45:00
U.S. DELIVERIES UP BY 1.7%
Total petroleum deliveries in April moved up by 1.7 percent from April 2016 to average 19.6 million barrels per day. These were the highest April deliveries in nine years, since 2008. Compared with March, total domestic petroleum deliveries, a measure of U.S. petroleum demand, decreased 0.3 percent. For year to date, total domestic petroleum deliveries moved up slightly by 0.1 percent compared to the same period last year to average 19.4 million barrels per day.
2017, May, 19, 12:30:00
NORWAY'S PRODUCTION DOWN 38 TBD
Preliminary production figures for April 2017 show an average daily production of 2 111 000 barrels of oil, NGL and condensate, which is an decrease of 38 000 barrels per day (approx. 2 percent) compared to March.


