2015-01-06 13:25:00
ENERGY PRICE DECLINES
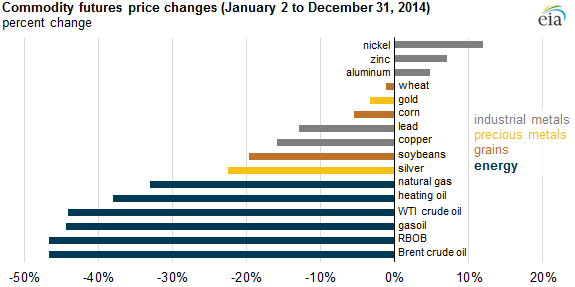
The first eight months of 2014 were much like 2013, as energy commodities remained in a relatively stable price range. During the last four months of 2014, however, crude oil and petroleum product prices fell dramatically, and ended the year with the largest price drops of all major commodities in the S&P Goldman Sachs Commodity Index (GSCI). Prices for nickel, zinc, and aluminum were among the few commodities that increased in 2014, while the prices of crude oil, petroleum products, natural gas, grains, and other metals declined.
In 2014, the energy component of the GSCI fell 43% from the start of the year. The S&P GSCI precious metals, industrial metals, and grains indices declined only 6%, 8%, and 8%, respectively, over the same period. Price movements in major commodity groups often move together when there are strong underlying trends in global economic growth. At times, however, commodity prices can deviate from one another as supply-side factors unique to a particular commodity or group of commodities arise.

Energy.
Two benchmark crude oils, West Texas Intermediate (WTI) and Brent, make up about 67% of the weighting in the S&P GSCI energy index. Petroleum-based products (gasoline, heating oil, and gasoil) together comprise another 29% of the S&P GSCI energy index, and because prices for these products generally follow crude oil prices, the index tends to follow the major price movements in the crude oil market.
At the end of June, with elevated risk for supply disruptions in Iraq, the S&P GSCI energy index rose to its highest point of the year, reaching 10% above starting levels. In the second half of the year, higher, sustained increases in crude oil supply and lower expected global economic growth in 2014 and 2015 contributed to a rapid decline in crude oil prices, causing the prolonged decline in the index.
Natural gas accounts for the remaining 4% of the S&P GSCI energy index, and its price decline of 33% was the lowest price decline among energy commodities in the GSCI. Natural gas prices in February rose to levels not seen since 2008 as the United States experienced a very cold winter. Natural gas storage levels declined until the spring, which helped support prices through much of the first half of the year. Increased natural gas production in the spring and summer led to record injections, bringing storage levels closer to the five-year range and pushing prices lower.
Grains.
The S&P GSCI grains index, a subindex of the larger S&P GSCI agriculture index, includes corn, wheat, and soybeans, with corn accounting for just over 40% of the weighting. The S&P GSCI grains index reached a high point in late spring as worries grew over lower crop yield and damage from the 2013-14 winter. However, as the planting and harvesting periods concluded, the U.S. Department of Agriculture (USDA) estimated that 2014 corn and soybean production would reach record levels. Increased supply of these grains added significant downward pressure on prices and, by late September, resulted in the S&P GSCI index falling as much as 22% below its level at the beginning of 2014.
Metals.
Copper and aluminum comprise almost 80% of the S&P GSCI industrial metals index, with lead, nickel, and zinc making up the remainder. Reduced aluminum production and steady inventory declines as tracked by the London Metal Exchange resulted in increased aluminum prices. Similarly, zinc prices reached a three-year high in July as inventories fell to the lowest level since the end of 2010. Nickel prices increased in early 2014 on news of an export ban enacted by Indonesia, a major supplier. On the other hand, copper prices ended the year down mainly in reaction to slower economic growth in China.
The S&P GSCI precious metals index is composed of two metals: gold (86%) and silver (14%). A stronger U.S. dollar and reduced physical demand for gold due to weak economic growth in emerging markets lowered gold prices during the second half of 2014.
eia.gov


