U.S. RIGS DOWN 4

|
|
|
|
Week |
|
Year |
|||||||
|
Location |
Week |
+/- |
Ago |
+/- |
Ago |
|||||||
|
|
|
|
|
|
|
|||||||
|
Land |
731 |
-3 |
734 |
-1132 |
1863 |
|||||||
|
Inland Waters |
3 |
-2 |
5 |
-10 |
13 |
|||||||
|
Offshore |
33 |
1 |
32 |
-19 |
52 |
|||||||
|
United States Total |
767 |
-4 |
771 |
-1161 |
1928 |
|||||||
|
|
|
|
|
|
|
|||||||
|
Gulf Of Mexico |
33 |
1 |
32 |
-17 |
50 |
|||||||
|
Canada |
176 |
-9 |
185 |
-226 |
402 |
|||||||
|
North America |
943 |
-13 |
956 |
-1387 |
2330 |
|||||||
|
|
|
|
|
|
|
|||||||
|
U.S. Breakout Information |
This Week |
+/- |
Last Week |
+/- |
Year Ago |
|||||||
|
|
|
|
|
|
|
|||||||
|
Oil |
574 |
2 |
572 |
-1004 |
1578 |
|||||||
|
Gas |
193 |
-6 |
199 |
-157 |
350 |
|||||||
|
|
|
|
|
|
|
|||||||
|
Directional |
72 |
-9 |
81 |
-133 |
205 |
|||||||
|
Horizontal |
587 |
2 |
585 |
-782 |
1369 |
|||||||
|
Vertical |
108 |
3 |
105 |
-246 |
354 |
|||||||
|
|
|
|
|
|
|
|||||||
|
Canada Breakout Information |
This Week |
+/- |
Last Week |
+/- |
Year Ago |
|||||||
|
|
|
|
|
|
|
|||||||
|
Oil |
68 |
-11 |
79 |
-148 |
216 |
|||||||
|
Gas |
108 |
2 |
106 |
-78 |
186 |
|||||||
|
Miscellaneous |
0 |
0 |
0 |
0 |
0 |
|||||||
|
|
|
|
|
|
|
|||||||
|
Major State Variances |
This Week |
+/- |
Last Week |
+/- |
Year Ago |
|||||||
|
|
|
|
|
|
|
|||||||
|
Alaska |
13 |
0 |
13 |
5 |
8 |
|||||||
|
Arkansas |
4 |
0 |
4 |
-8 |
12 |
|||||||
|
California |
10 |
-2 |
12 |
-37 |
47 |
|||||||
|
Colorado |
32 |
-1 |
33 |
-43 |
75 |
|||||||
|
Kansas |
10 |
0 |
10 |
-17 |
27 |
|||||||
|
Louisiana |
69 |
-1 |
70 |
-41 |
110 |
|||||||
|
New Mexico |
38 |
1 |
37 |
-61 |
99 |
|||||||
|
North Dakota |
62 |
-1 |
63 |
-119 |
181 |
|||||||
|
Ohio |
20 |
0 |
20 |
-26 |
46 |
|||||||
|
Oklahoma |
85 |
2 |
83 |
-122 |
207 |
|||||||
|
Pennsylvania |
28 |
0 |
28 |
-25 |
53 |
|||||||
|
Texas |
338 |
-2 |
340 |
-564 |
902 |
|||||||
|
Utah |
5 |
0 |
5 |
-18 |
23 |
|||||||
|
West Virginia |
16 |
0 |
16 |
-16 |
32 |
|||||||
|
Wyoming |
24 |
0 |
24 |
-38 |
62 |
|||||||
|
|
|
|
|
|
|
|||||||
|
Major Basin Variances |
This Week |
+/- |
Last Week |
+/- |
Year Ago |
|||||||
|
|
|
|
|
|
|
|||||||
|
Ardmore Woodford |
2 |
0 |
2 |
-4 |
6 |
|||||||
|
Arkoma Woodford |
10 |
0 |
10 |
4 |
6 |
|||||||
|
Barnett |
6 |
1 |
5 |
-17 |
23 |
|||||||
|
Cana Woodford |
32 |
0 |
32 |
-2 |
34 |
|||||||
|
DJ-Niobrara |
28 |
0 |
28 |
-35 |
63 |
|||||||
|
Eagle Ford |
73 |
1 |
72 |
-135 |
208 |
|||||||
|
Fayetteville |
4 |
0 |
4 |
-5 |
9 |
|||||||
|
Granite Wash |
13 |
-1 |
14 |
-45 |
58 |
|||||||
|
Haynesville |
27 |
2 |
25 |
-15 |
42 |
|||||||
|
Marcellus |
43 |
0 |
43 |
-37 |
80 |
|||||||
|
Mississippian |
12 |
-1 |
13 |
-65 |
77 |
|||||||
|
Permian |
229 |
-3 |
232 |
-339 |
568 |
|||||||
|
Utica |
21 |
0 |
21 |
-29 |
50 |
|||||||
|
Williston |
63 |
-1 |
64 |
-130 |
193 |
|||||||
U.S. Rig Count is down 4 rigs from last week to 767, with oil rigs up 2 to 574, and gas rigs down 6 to 193.
U.S. Rig Count is down 1,161 rigs from last year at 1,928, with oil rigs down 1,004, and gas rigs down 157.
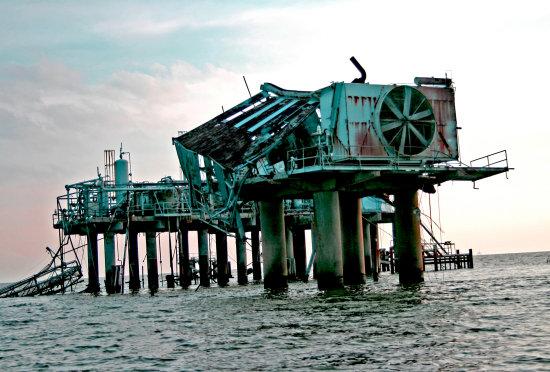
The U.S. Offshore rig count is 33, up 1 rig from last week, and down 19 rigs year over year.
Canadian Rig Count is down 9 rigs from last week to 176, with oil rigs down 11 to 68, and gas rigs up 2 to 108.
Canadian Rig Count is down 226 rigs from last year at 402, with oil rigs down 148, and gas rigs down 78.
-----
More:


