2016-12-26 18:30:00
U.S. RIGS UP 16
BAKER HUGHES wrote,
U.S. Rig Count is up 16 rigs from last week to 653, with oil rigs up 13 to 523, gas rigs up 3 to 129, and miscellaneous rigs unchanged at 1.
U.S. Rig Count is down 47 rigs from last year's count of 700, with oil rigs down 15, gas rigs down 33, and miscellaneous rigs up 1.
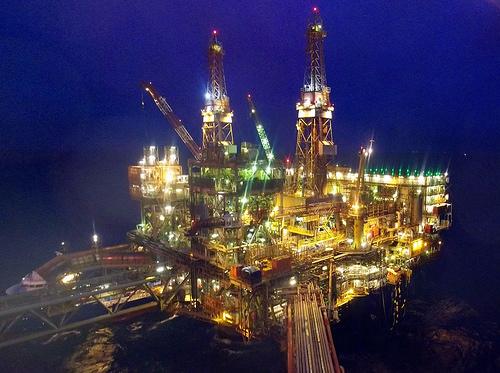
The U.S. Offshore Rig Count is up 3 rigs from last week at 25 and up 1 rig year over year.
Canadian Rig Count is down 10 rigs from last week to 224, with oil rigs down 10 to 106, gas rigs down 3 to 113, and miscellaneous rigs up 3 to 5.
Canadian Rig Count is up 98 rigs from last year's count of 126, with oil rigs up 62, gas rigs up 31, and miscellaneous rigs up 5.
| Week | Year | ||||||||||
| Location | Week | +/- | Ago | +/- | Ago | ||||||
| Land | 627 | 13 | 614 | -48 | 675 | ||||||
| Inland Waters | 1 | 0 | 1 | 0 | 1 | ||||||
| Offshore | 25 | 3 | 22 | 1 | 24 | ||||||
| United States Total | 653 | 16 | 637 | -47 | 700 | ||||||
| Gulf Of Mexico | 24 | 2 | 22 | 0 | 24 | ||||||
| Canada | 224 | -10 | 234 | 98 | 126 | ||||||
| North America | 877 | 6 | 871 | 51 | 826 | ||||||
| U.S. Breakout Information | This Week | +/- | Last Week | +/- | Year Ago | ||||||
| Oil | 523 | 13 | 510 | -15 | 538 | ||||||
| Gas | 129 | 3 | 126 | -33 | 162 | ||||||
| Miscellaneous | 1 | 0 | 1 | 1 | 0 | ||||||
| Directional | 58 | 4 | 54 | -2 | 60 | ||||||
| Horizontal | 526 | 14 | 512 | -28 | 554 | ||||||
| Vertical | 69 | -2 | 71 | -17 | 86 | ||||||
| Canada Breakout Information | This Week | +/- | Last Week | +/- | Year Ago | ||||||
| Oil | 106 | -10 | 116 | 62 | 44 | ||||||
| Gas | 113 | -3 | 116 | 31 | 82 | ||||||
| Miscellaneous | 5 | 3 | 2 | 5 | 0 | ||||||
| Major State Variances | This Week | +/- | Last Week | +/- | Year Ago | ||||||
| Alaska | 9 | 3 | 6 | -2 | 11 | ||||||
| Arkansas | 1 | -1 | 2 | 0 | 1 | ||||||
| California | 6 | 0 | 6 | -3 | 9 | ||||||
| Colorado | 28 | 1 | 27 | 4 | 24 | ||||||
| Kansas | 1 | 0 | 1 | -11 | 12 | ||||||
| Louisiana | 48 | 1 | 47 | -8 | 56 | ||||||
| New Mexico | 33 | 1 | 32 | -5 | 38 | ||||||
| North Dakota | 32 | 1 | 31 | -23 | 55 | ||||||
| Ohio | 19 | 1 | 18 | 4 | 15 | ||||||
| Oklahoma | 84 | 6 | 78 | -4 | 88 | ||||||
| Pennsylvania | 32 | 1 | 31 | 6 | 26 | ||||||
| Texas | 321 | 4 | 317 | 2 | 319 | ||||||
| Utah | 4 | 0 | 4 | 1 | 3 | ||||||
| West Virginia | 8 | -2 | 10 | -8 | 16 | ||||||
| Wyoming | 19 | 1 | 18 | 2 | 17 | ||||||
| Major Basin Variances | This Week | +/- | Last Week | +/- | Year Ago | ||||||
| Ardmore Woodford | 1 | 1 | 0 | -1 | 2 | ||||||
| Arkoma Woodford | 4 | 0 | 4 | -4 | 8 | ||||||
| Barnett | 3 | 0 | 3 | -5 | 8 | ||||||
| Cana Woodford | 36 | 2 | 34 | -3 | 39 | ||||||
| DJ-Niobrara | 25 | 1 | 24 | 2 | 23 | ||||||
| Eagle Ford | 44 | 0 | 44 | -33 | 77 | ||||||
| Fayetteville | 1 | 0 | 1 | 0 | 1 | ||||||
| Granite Wash | 14 | 0 | 14 | -1 | 15 | ||||||
| Haynesville | 27 | 0 | 27 | 3 | 24 | ||||||
| Marcellus | 39 | -1 | 40 | -2 | 41 | ||||||
| Mississippian | 3 | 0 | 3 | -9 | 12 | ||||||
| Permian | 262 | 4 | 258 | 50 | 212 | ||||||
| Utica | 20 | 1 | 19 | 4 | 16 | ||||||
| Williston | 32 | 1 | 31 | -23 | 55 | ||||||
-----
Earlier:


