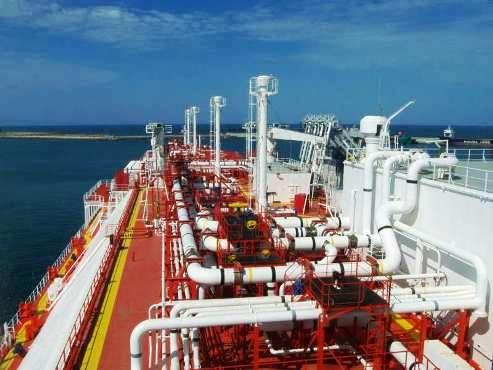
GLOBAL LNG UP 2.5%

World LNG trade grew by 2.5% to an all-time high of 245.2mn metric tons in 2015, according to the latest annual report of the International Group of Liquefied Natural Gas Importers (GIIGNL).
Europe became a low-priced 'market of last resort' for the global LNG trade, with most world supply growth absorbed by the region -- up 16% at 83.15mn mt, as net imports recovered thanks in part to a 31% fall in re-exports – but imports by the Middle East also grew.
GIIGNL's president since 2012 Domenico Dispenza wrote: "In a global context of lower energy prices and sluggish economic growth, the LNG industry is holding its breath for the impact of an export wave from the US." His preface to the report was headed "Abundant Supply, Wavering Demand."
Qatar remained the leading supplier, with 32% of trade in 2015, but former Eni gas chief Dispenza noted the "US is on track to challenge Qatar as the world's leading supplier of flexible LNG." Australia last year became the second largest exporter, ahead of Malaysia which was No.2 in 2014.
Only two new liquefaction plants started up in 2015 -- Donggi-Senoro in Indonesia and GLNG in Australia – although the giant QCLNG complex opened at the very end of 2014. In contrast, in Q1 2016 alone the giant Sabine Pass (US) and Gorgon (Australia) complexes have started exports – although a technical fault has temporarily halted shipments from Gorgon. Angola LNG remained closed in 2015 for substantial repairs while Yemeni exports were curtailed by the ongoing security crisis.
Although Chinese LNG imports increased by 5.5%, despite a 25 year-low in GDP growth, Asia as a whole in 2015 declined by 1.7% -- with top two global markets Japan and South Korea falling by 4.7% and 11.2% respectively to 85mn and 33.4mn mt. Yet Asia still absorbed 72% of world LNG trade, according to the report published late last week.
The volume of LNG traded on a spot or short-term basis remained stable at 28% of world trade, or 68.4mn mt, as declines in imports from traditional short-term buyers Argentina and Brazil, plus a dip in such imports by Japan and Korea, were offset by extra volumes into the relatively new markets Egypt, Jordan and Pakistan. Truly 'spot' trades – delivered within 90 days of transactions – were estimated at 15% of world trade, so roughly half the 28% figure.
In 2015, 7 new LNG regasification terminals -- three onshore (2 in Japan and 1 in Indonesia) and four offshore (2 in Egypt, 1 in Jordan, 1 in Pakistan) – started up, bringing a total of 23.5mn mt/yr additional capacity. Poland received its first cargo late 2015, but GIIGNL deemed it as starting up only this year.
World LNG Trade in 2015
| LNG imports* | mn mt | % change vs | Source of LNG imports | mn mt | % change vs | |
| 2015 | 2014 | 2015 | 2014 | |||
| Belgium | 1.87 | 93.9 | Algeria | 12.13 | -4.6 | |
| France | 4.35 | -5 | Equatorial Guinea | 3.65 | 8 | |
| Greece | 0.45 | 18.6 | Nigeria | 19.5 | 1.9 | |
| Italy | 4.32 | 31.9 | Norway | 4.33 | 22 | |
| Lithuania | 0.32 | 193.4 | Trinidad & Tobago | 11.81 | -9.8 | |
| Netherlands | 0.63 | 50.5 | Atlantic Basin | 51.43 | -2.1 | |
| Portugal | 1.09 | 12.5 | ||||
| Spain | 8.82 | 11.7 | Abu Dhabi | 5.7 | -6.2 | |
| Sweden | 0.29 | na | Oman | 7.56 | -2.2 | |
| Turkey | 5.35 | -1.9 | Qatar | 78.4 | 2.7 | |
| UK | 10.08 | 20.1 | Yemen | 1.52 | -75.8 | |
| Europe | 37.57 | 15.8 | Middle East | 93.19 | -3.4 | |
| Argentina | 4.08 | -7.7 | Australia | 29.45 | 24.8 | |
| Brazil | 4.78 | -10.4 | Brunei | 6.48 | 5.9 | |
| Chile | 2.74 | 6.7 | USA (Alaska) | 0.32 | 28.3 | |
| Dominican Rep | 0.87 | 5.3 | Indonesia | 18.03 | 3.7 | |
| Mexico | 4.94 | -25 | Malaysia | 24.99 | 0.6 | |
| Puerto Rico (US) | 1.15 | -8.2 | Papua New Guinea | 7.18 | 112.2 | |
| Canada | 0.49 | 21.6 | Peru | 3.57 | -11.5 | |
| USA | 1.7 | 46.8 | Russia | 10.57 | -0.1 | |
| Americas | 20.73 | -8 | Pacific Basin | 100.58 | 11.5 | |
| China | 20.02 | 5.5 | Total | 245.19 | 2.5 | |
| India | 14.6 | 0.4 | ||||
| Indonesia | 2.18 | 39.9 | ||||
| Japan | 85.05 | -4.7 | ||||
| Malaysia | 1.53 | -7.2 | ||||
| Pakistan | 1.05 | na | ||||
| Singapore | 2.08 | 23.6 | ||||
| South Korea | 33.42 | -11.2 | ||||
| Taiwan | 14.45 | 7.4 | ||||
| Thailand | 2.7 | 92.9 | ||||
| Asia | 177.07 | -1.7 | ||||
| Dubai | 2.21 | 64.8 | ||||
| Egypt | 2.6 | na | ||||
| Israel | 0.12 | 45 | ||||
| Jordan | 1.85 | na | ||||
| Kuwait | 3.04 | 13.3 | ||||
| Middle East | 9.82 | 139.1 | ||||
| Total | 245.19 | 2.5 |
* net of re-exports; na = not available
-----
More:
GLOBAL OIL & GAS TRANSFORMATION
RUSSIA’S ENERGY STRATEGY - 2030


