2017-01-16 18:30:00
U.S. RIGS DOWN 6
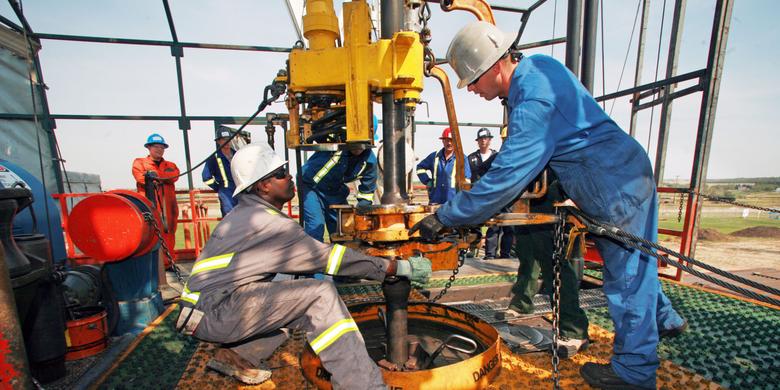
BAKER HUGHES wrote,
U.S. Rig Count is down 6 rigs from last week to 659, with oil rigs down 7 to 522, gas rigs up 1 to 136, and miscellaneous rigs unchanged at 1.
U.S. Rig Count is up 9 rigs from last year's count of 650, with oil rigs up 7, gas rigs up 1, and miscellaneous rigs up 1.
The U.S. Offshore Rig Count is up 1 rig from last week at 25 and down 1 rig year over year.
Canadian Rig Count is up 110 rigs from last week to 315, with oil rigs up 89 to 170, gas rigs up 21 to 144, and miscellaneous rigs unchanged at 1.
Canadian Rig Count is up 88 rigs from last year's count of 227, with oil rigs up 60, gas rigs up 27, and miscellaneous rigs up 1.
| Week | Year | ||||||||||
| Location | Week | +/- | Ago | +/- | Ago | ||||||
| Land | 634 | -6 | 640 | 11 | 623 | ||||||
| Inland Waters | 0 | -1 | 1 | -1 | 1 | ||||||
| Offshore | 25 | 1 | 24 | -1 | 26 | ||||||
| United States Total | 659 | -6 | 665 | 9 | 650 | ||||||
| Gulf Of Mexico | 24 | 1 | 23 | -2 | 26 | ||||||
| Canada | 315 | 110 | 205 | 88 | 227 | ||||||
| North America | 974 | 104 | 870 | 97 | 877 | ||||||
| U.S. Breakout Information | This Week | +/- | Last Week | +/- | Year Ago | ||||||
| Oil | 522 | -7 | 529 | 7 | 515 | ||||||
| Gas | 136 | 1 | 135 | 1 | 135 | ||||||
| Miscellaneous | 1 | 0 | 1 | 1 | 0 | ||||||
| Directional | 59 | 2 | 57 | -3 | 62 | ||||||
| Horizontal | 537 | 3 | 534 | 26 | 511 | ||||||
| Vertical | 63 | -11 | 74 | -14 | 77 | ||||||
| Canada Breakout Information | This Week | +/- | Last Week | +/- | Year Ago | ||||||
| Oil | 170 | 89 | 81 | 60 | 110 | ||||||
| Gas | 144 | 21 | 123 | 27 | 117 | ||||||
| Miscellaneous | 1 | 0 | 1 | 1 | 0 | ||||||
| Major State Variances | This Week | +/- | Last Week | +/- | Year Ago | ||||||
| Alaska | 8 | 0 | 8 | -1 | 9 | ||||||
| Arkansas | 1 | 0 | 1 | 1 | 0 | ||||||
| California | 6 | 0 | 6 | -2 | 8 | ||||||
| Colorado | 28 | -1 | 29 | 8 | 20 | ||||||
| Kansas | 0 | 0 | 0 | -12 | 12 | ||||||
| Louisiana | 51 | 1 | 50 | -3 | 54 | ||||||
| New Mexico | 37 | 0 | 37 | 5 | 32 | ||||||
| North Dakota | 32 | -1 | 33 | -15 | 47 | ||||||
| Ohio | 19 | -1 | 20 | 6 | 13 | ||||||
| Oklahoma | 84 | -2 | 86 | -3 | 87 | ||||||
| Pennsylvania | 32 | -1 | 33 | 6 | 26 | ||||||
| Texas | 325 | -2 | 327 | 24 | 301 | ||||||
| Utah | 4 | 0 | 4 | 1 | 3 | ||||||
| West Virginia | 8 | 0 | 8 | -4 | 12 | ||||||
| Wyoming | 19 | 2 | 17 | 4 | 15 | ||||||
| Major Basin Variances | This Week | +/- | Last Week | +/- | Year Ago | ||||||
| Ardmore Woodford | 1 | 0 | 1 | -2 | 3 | ||||||
| Arkoma Woodford | 4 | 0 | 4 | -4 | 8 | ||||||
| Barnett | 2 | -1 | 3 | -3 | 5 | ||||||
| Cana Woodford | 37 | 0 | 37 | 0 | 37 | ||||||
| DJ-Niobrara | 23 | -2 | 25 | 4 | 19 | ||||||
| Eagle Ford | 47 | 0 | 47 | -21 | 68 | ||||||
| Fayetteville | 1 | 0 | 1 | 1 | 0 | ||||||
| Granite Wash | 9 | -1 | 10 | -5 | 14 | ||||||
| Haynesville | 28 | -1 | 29 | 5 | 23 | ||||||
| Marcellus | 39 | -1 | 40 | 1 | 38 | ||||||
| Mississippian | 2 | -1 | 3 | -10 | 12 | ||||||
| Permian | 268 | 1 | 267 | 66 | 202 | ||||||
| Utica | 20 | -1 | 21 | 7 | 13 | ||||||
| Williston | 32 | -1 | 33 | -15 | 47 | ||||||
-----
Earlier:


