2017-10-25 12:20:00
U.S. ECONOMY & EMPLOYMENT 2016 - 2026
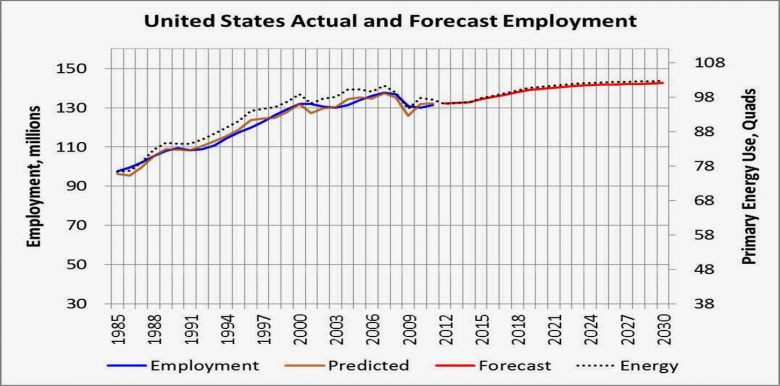
U.S. DEPARTMENT OF LABOR - Projections overview and highlights, 2016–26
Changing demographics in the population will have far-reaching effects on the labor force, the economy, and employment over the 2016–26 decade. The overall labor force participation rate is projected to decline as older workers leave the labor force, constraining economic growth. The aging baby-boomer segment of the population will drive demand for healthcare services and related occupations.
Continued slow labor force growth; moderate economic growth, which is faster than the previous decade; and continued increases in healthcare employment are a few highlights from the most recent projections prepared by the U.S. Bureau of Labor Statistics (BLS). These projections provide a comprehensive view of expected changes in the U.S. economy over the 2016–26 decade. The projections comprise nearly every facet of the economy, from population and labor force to gross domestic product (GDP) and productivity.
Some highlights include the following:
- The labor force is projected to grow at a compound annual rate of 0.6 percent, from 159.2 million people in 2016 to 169.7 million people in 2026—an increase of about 10.5 million people.
- GDP is projected to grow 2.0 percent annually over the projections decade, about 1.5 times the rate of the previous decade, 2006–16, when GDP grew 1.4 percent annually.
- Real output in the service-providing sectors is projected to grow at an annual rate of 2.2 percent from 2016 to 2026, which is faster than the 1.0-percent growth experienced from 2006 to 2016.
- Healthcare and related occupations account for 17 of the 30 fastest growing occupations from 2016 to 2026. Other occupations in the top 30 are generally energy-related occupations or employed in computer and information industries.
The labor force is projected to grow at an annual rate of 0.6 percent. This rate of growth is in response to the slow expected population growth of those 16 years and older and to changes in the population age composition and the labor force participation rates of the different age, gender, and race and ethnic groups.
The projected 2.0-percent annual growth in GDP over 2016–26 is higher than that experienced over the previous 10 years—a period heavily affected by the 2007–09 recession. However, economic growth is not expected to reach the 3.0 percent or higher growth rate achieved over most of the 1970s through early 2000s. The U.S. economy is undergoing structural changes, largely attributable to the higher percentage of population in older age groups with much lower participation rates in the labor force. With fewer people working, the economy has limited capacity to generate as much economic output.
By 2026, the service-providing industry sectors are projected to account for more than 81 percent of all wage and salary jobs in the economy and for most of the job growth. The health care and social assistance sector will account for more than one-third of the jobs added over the projections decade. The real output of the total service-providing sectors is projected to grow slightly faster than that of the overall economy from 2016 to 2026. Although employment in the goods-producing sectors is expected to grow by an annual rate of 0.1 percent from 2016 to 2026, real output in those sectors is expected to grow 2.1 percent annually over the decade.
Occupational employment is projected to grow by 7.4 percent from 2016 to 2026, nearly 1.0 percent faster than the projected growth during the 2014–24 decade. Employment growth is projected for nearly all occupational groups, from healthcare to transportation occupations. The only occupational group projected to decline from 2016 to 2026 is production occupations, at a rate of 4.1 percent. These declines are due primarily to expected employment losses in the manufacturing sector.
-----
Earlier:

2017, October, 23, 11:20:00
U.S. DEFICIT - 2017: $666 BLNU.S. Treasury Secretary Steven T. Mnuchin and Office of Management and Budget (OMB) Director Mick Mulvaney today released details of the fiscal year (FY) 2017 final budget results. The deficit in FY 2017 was $666 billion, $80 billion more than in the prior fiscal year, but $36 billion less than forecast in the FY 2018 Mid-Session Review (MSR). As a percentage of Gross Domestic Product (GDP), the deficit was 3.5 percent, 0.3 percentage point higher than the previous year. |

2017, October, 20, 12:25:00
U.S. FOREIGN ACQUISITIONS UP $125 BLNThe sum total in August of all net foreign acquisitions of long-term securities, short-term U.S. securities, and banking flows was a monthly net TIC inflow of $125.0 billion. Of this, net foreign private inflows were $131.5 billion, and net foreign official outflows were $6.5 billion.
|

2017, October, 16, 11:55:00
U.S. ECONOMY UPEconomic activity in the United States has been growing moderately so far this year, and the labor market has continued to strengthen. The terrible hurricanes that hit Texas, Florida, Puerto Rico, and our neighbors in the Caribbean caused tremendous damage and upended many lives, and our hearts go out to those affected. While the effects of the hurricanes on the U.S. economy are quite noticeable in the short term, history suggests that the longer-term effects will be modest and that aggregate economic activity will recover quickly.
|

2017, October, 6, 12:35:00
U.S. DEFICIT DOWN TO $42.4 BLNThe U.S. Census Bureau and the U.S. Bureau of Economic Analysis, through the Department of Commerce, announced today that the goods and services deficit was $42.4 billion in August, down $1.2 billion from $43.6 billion in July, revised. August exports were $195.3 billion, $0.8 billion more than July exports. August imports were $237.7 billion, $0.4 billion less than July imports.
|

2017, September, 22, 08:30:00
U.S. FEDERAL FUNDS RATE: 1 - 1.25%In view of realized and expected labor market conditions and inflation, the Committee decided to maintain the target range for the federal funds rate at 1 to 1-1/4 percent. The stance of monetary policy remains accommodative, thereby supporting some further strengthening in labor market conditions and a sustained return to 2 percent inflation.
|

2016, August, 8, 18:55:00
U.S. DEFICIT UP TO $44.5 BLNThe deficit rose to $44.5 billion in June, 8.7 percent higher than a revised May deficit of $41 billion, the Commerce Department reported Friday. It was the biggest gap between what America sells abroad and what the country imports since a $44.6 billion deficit last August.
|

2016, June, 28, 18:10:00
U.S. JOBS DOWN 100,000Total upstream jobs in the state during May averaged 205,100, down 21.2% from the May 2015 average and 33% from the estimated high of 306,020 in December 2014. Estimates from the TPI show the trough in upstream employment before December 2014 was 184,640 in October 2009. During the previous growth cycle, industry employment peaked at 225,965 in October 2008. |


