U.S. RIGS UP 5 TO 940

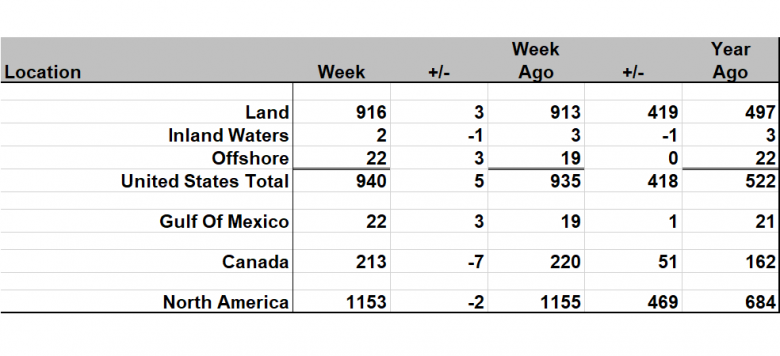
U.S. Rig Count is up 5 rigs from last week to 940, with oil rigs up 6 to 750, gas rigs down 1 to 189, and miscellaneous rigs unchanged at 1.
U.S. Rig Count is up 418 rigs from last year's count of 522, with oil rigs up 325, gas rigs up 93, and miscellaneous rigs unchanged at 1.
The U.S. Offshore Rig Count is up 3 rigs from last week to 22 and unchanged year-over-year.
Canada Rig Count is down 7 rigs from last week to 213, with oil rigs down 9 to 113 and gas rigs up 2 to 100.
Canada Rig Count is up 51 rigs from last year's count of 162, with oil rigs up 29 and gas rigs up 22.
| Week | Year | ||||||||
| Location | Week | +/- | Ago | +/- | Ago | ||||
| Land | 916 | 3 | 913 | 419 | 497 | ||||
| Inland Waters | 2 | -1 | 3 | -1 | 3 | ||||
| Offshore | 22 | 3 | 19 | 0 | 22 | ||||
| United States Total | 940 | 5 | 935 | 418 | 522 | ||||
| Gulf Of Mexico | 22 | 3 | 19 | 1 | 21 | ||||
| Canada | 213 | -7 | 220 | 51 | 162 | ||||
| North America | 1153 | -2 | 1155 | 469 | 684 | ||||
| U.S. Breakout Information | This Week | +/- | Last Week | +/- | Year Ago | ||||
| Oil | 750 | 6 | 744 | 325 | 425 | ||||
| Gas | 189 | -1 | 190 | 93 | 96 | ||||
| Miscellaneous | 1 | 0 | 1 | 0 | 1 | ||||
| Directional | 82 | 5 | 77 | 31 | 51 | ||||
| Horizontal | 794 | 4 | 790 | 387 | 407 | ||||
| Vertical | 64 | -4 | 68 | 0 | 64 | ||||
| Canada Breakout Information | This Week | +/- | Last Week | +/- | Year Ago | ||||
| Oil | 113 | -9 | 122 | 29 | 84 | ||||
| Gas | 100 | 2 | 98 | 22 | 78 | ||||
| Major State Variances | This Week | +/- | Last Week | +/- | Year Ago | ||||
| Alaska | 5 | 0 | 5 | -2 | 7 | ||||
| Arkansas | 0 | 0 | 0 | -1 | 1 | ||||
| California | 16 | 0 | 16 | 10 | 6 | ||||
| Colorado | 33 | 0 | 33 | 13 | 20 | ||||
| Louisiana | 67 | 2 | 65 | 26 | 41 | ||||
| New Mexico | 69 | 1 | 68 | 39 | 30 | ||||
| North Dakota | 50 | 1 | 49 | 20 | 30 | ||||
| Ohio | 29 | 0 | 29 | 15 | 14 | ||||
| Oklahoma | 124 | -3 | 127 | 56 | 68 | ||||
| Pennsylvania | 33 | 0 | 33 | 10 | 23 | ||||
| Texas | 451 | -2 | 453 | 206 | 245 | ||||
| Utah | 12 | 4 | 8 | 7 | 5 | ||||
| West Virginia | 16 | 0 | 16 | 6 | 10 | ||||
| Wyoming | 25 | 0 | 25 | 12 | 13 | ||||
| Major Basin Variances | This Week | +/- | Last Week | +/- | Year Ago | ||||
| Ardmore Woodford | 2 | 0 | 2 | 2 | 0 | ||||
| Arkoma Woodford | 9 | 0 | 9 | 5 | 4 | ||||
| Barnett | 7 | 0 | 7 | 6 | 1 | ||||
| Cana Woodford | 62 | -1 | 63 | 27 | 35 | ||||
| DJ-Niobrara | 25 | -1 | 26 | 8 | 17 | ||||
| Eagle Ford | 68 | 0 | 68 | 32 | 36 | ||||
| Fayetteville | 0 | 0 | 0 | -1 | 1 | ||||
| Granite Wash | 13 | -1 | 14 | 3 | 10 | ||||
| Haynesville | 44 | -1 | 45 | 31 | 13 | ||||
| Marcellus | 47 | 0 | 47 | 15 | 32 | ||||
| Mississippian | 4 | 0 | 4 | 1 | 3 | ||||
| Permian | 385 | -1 | 386 | 181 | 204 | ||||
| Utica | 30 | 0 | 30 | 15 | 15 | ||||
| Williston | 50 | 1 | 49 | 20 | 30 | ||||
-----
Earlier:
USA: |
CANADA: |
||
|
September, 29, 12:25:00 U.S. HIGHEST PELROLEUM DEMANDTotal petroleum deliveries in August moved up by 1.3 percent from August 2016 to average 20.5 million barrels per day. These were the highest August deliveries in 10 years, since 2007. Compared with July, total domestic petroleum deliveries, a measure of U.S. petroleum demand, decreased 0.6 percent. For year-to-date, total domestic petroleum deliveries moved up 1.3 percent compared to the same period last year
|
September, 29, 12:10:00 CANADA NEED $60“Fifty-dollar WTI is not high enough to support a material uptick in oilsands investments,” said Randy Ollenberger, managing director of oil and gas equity research for BMO Capital Markets. “Sustained US$60-plus oil prices are required to support most projects.”
|
||
|
September, 20, 08:50:00 U.S. OIL + 79 TBD, GAS + 788 MCFDCrude oil output from the seven major US onshore producing regions is forecast to increase 79,000 b/d month-over-month in October to 6.083 million b/d. Natural gas production from the seven regions is expected to climb 788 MMcfd month-over-month in October to 59.745 bcfd. |
August, 3, 12:10:00 CANADIAN DRILLING UPThe Petroleum Services Association of Canada (PSAC) has updated its 2017 Canadian Drilling Activity Forecast to reflect an increase in its projected total number of wells to be drilled during the year to 7,200 from 6,680. |
||
|
September, 18, 12:30:00 RUSSIA - CHINA - VENEZUELA OIL“The principal risk regarding Russian and Chinese activities in Venezuela in the near term is that they will exploit the unfolding crisis, including the effect of US sanctions, to deepen their control over Venezuela’s resources, and their [financial] leverage over the country as an anti-US political and military partner,” observed R. Evan Ellis, a senior associate in the Center for Strategic and International Studies’ Americas Program. |
July, 19, 14:40:00 CANADA'S ECONOMY UP 4%IMF: Canada’s economy expanded at an annual pace of nearly 4 percent in the first quarter of 2017—the fastest growth rate among the Group of 7 countries. With the economy’s adjustment to lower oil prices almost complete, growth is expected to accelerate to 2.5 percent this year, up from 1.5 percent in 2016. |
||
|
September, 18, 12:20:00 U.S. - IRAN SANCTIONSOn Thursday, the administration extended certain sanctions on Iran's oil and banking sectors that have been suspended since the nuclear deal took place in January 2016. |
June, 1, 19:00:00 SHELL DIVESTS CANADA $8.2 BLNUnder the first agreement, Shell has completed the sale to a subsidiary of Canadian Natural Resources Limited (“Canadian Natural”) its entire 60% interest in AOSP, its 100% interest in the Peace River Complex in-situ assets, including Carmon Creek, and a number of undeveloped oil sands leases in Alberta, Canada. The consideration to Shell from Canadian Natural is approximately $8.2 billion (C$10.9 billion), comprised of $5.3 billion in cash plus around 98 million Canadian Natural shares currently valued at $2.9 billion. Shell’s share position in Canadian Natural will be managed for value realisation over time. |
||
|
September, 18, 12:05:00 U.S. RIGS DOWN 8 TO 936U.S. Rig Count is up 430 rigs from last year's count of 506, with oil rigs up 333, gas rigs up 97, and miscellaneous rigs unchanged at 1. Canada Rig Count is up 80 rigs from last year's count of 132, with oil rigs up 37, gas rigs up 44, and miscellaneous rigs down 1. |
May, 1, 12:05:00 CANADIAN WELLS UP TO 6,680The Petroleum Services Association of Canada (PSAC), in its second update to the 2017 Canadian Drilling Activity Forecast, announced its revision of the forecasted number of wells drilled (rig released) across Canada for 2017 to 6,680 wells. This represents an increase of 2,505 wells and a 60 per cent increase from PSAC’s original 2017 Drilling Activity Forecast released in early November 2016 of 4,175 wells rig released. PSAC based its updated 2017 forecast on average natural gas prices of $3.00 CDN/mcf (AECO), crude oil prices of US$52.50/barrel (WTI) and the Canada-US exchange rate averaging $0.74. |
||
|
September, 11, 12:10:00 WORLDWIDE RIG COUNT UP 6 TO 2,116The worldwide rig count for August 2017 was 2,116, up 6 from the 2,110 counted in July 2017, and up 569 from the 1,547 counted in August 2016. |
October, 21, 18:35:00 SHELL SELLS CANADA: $1 BLNShell’s net debt has more than doubled to $75bn since its £35bn takeover of BG Group was completed in February. |
||
|
September, 11, 12:05:00 U.S. RIGS UP 1 TO 944U.S. Rig Count is up 436 rigs from last year's count of 508, with oil rigs up 342, gas rigs up 95, and miscellaneous rigs down 1 to 1. Canada Rig Count is up 68 rigs from last year's count of 134, with oil rigs up 28 and gas rigs up 41, and miscellaneous rigs down 1 to 0. |
June, 28, 18:05:00 CANADA'S OIL WILL UPCanada's oil sands production will grow by 42 percent to 3.4 million barrels per day by 2025, most of which will come from the expansion of existing facilities rather than new projects |


