U.S. RIGS UP 9 TO 907

BAKER HUGHES A GE - U.S. Rig Count is up 9 rigs from last week to 907, with oil rigs up 9 to 738, gas rigs unchanged at 169, and miscellaneous rigs unchanged.
U.S. Rig Count is up 339 rigs from last year's count of 568, with oil rigs up 286, gas rigs up 54, and miscellaneous rigs down 1 to 1.
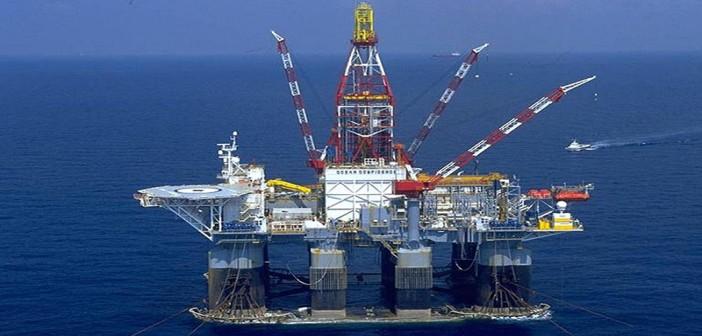
The U.S. Offshore Rig Count is unchanged from last week at 18 and down 3 rigs year-over-year.
Canada Rig Count is up 11 rigs from last week to 203, with oil rigs up 8 to 108 and gas rigs up 4 to 95, and miscellaneous rigs down 1 to 0.
Canada Rig Count is up 27 rigs from last year's count of 176, with oil rigs up 19 and gas rigs up 8.
| Week | Year | ||||||||
| Location | Week | +/- | Ago | +/- | Ago | ||||
| Land | 888 | 9 | 879 | 342 | 546 | ||||
| Inland Waters | 1 | 0 | 1 | 0 | 1 | ||||
| Offshore | 18 | 0 | 18 | -3 | 21 | ||||
| United States Total | 907 | 9 | 898 | 339 | 568 | ||||
| Gulf Of Mexico | 18 | 0 | 18 | -3 | 21 | ||||
| Canada | 203 | 11 | 192 | 27 | 176 | ||||
| North America | 1110 | 20 | 1090 | 366 | 744 | ||||
| U.S. Breakout Information | This Week | +/- | Last Week | +/- | Year Ago | ||||
| Oil | 738 | 9 | 729 | 286 | 452 | ||||
| Gas | 169 | 0 | 169 | 54 | 115 | ||||
| Miscellaneous | 0 | 0 | 0 | -1 | 1 | ||||
| Directional | 74 | 1 | 73 | 22 | 52 | ||||
| Horizontal | 776 | 12 | 764 | 319 | 457 | ||||
| Vertical | 57 | -4 | 61 | -2 | 59 | ||||
| Canada Breakout Information | This Week | +/- | Last Week | +/- | Year Ago | ||||
| Oil | 108 | 8 | 100 | 19 | 89 | ||||
| Gas | 95 | 4 | 91 | 8 | 87 | ||||
| Miscellaneous | 0 | -1 | 1 | 0 | 0 | ||||
| Major State Variances | This Week | +/- | Last Week | +/- | Year Ago | ||||
| Alaska | 6 | 1 | 5 | -1 | 7 | ||||
| Arkansas | 0 | 0 | 0 | -1 | 1 | ||||
| California | 14 | 0 | 14 | 8 | 6 | ||||
| Colorado | 37 | 0 | 37 | 19 | 18 | ||||
| Louisiana | 58 | 0 | 58 | 10 | 48 | ||||
| New Mexico | 69 | 4 | 65 | 38 | 31 | ||||
| North Dakota | 47 | 0 | 47 | 12 | 35 | ||||
| Ohio | 29 | 0 | 29 | 14 | 15 | ||||
| Oklahoma | 123 | 6 | 117 | 48 | 75 | ||||
| Pennsylvania | 31 | 0 | 31 | 5 | 26 | ||||
| Texas | 442 | -2 | 444 | 174 | 268 | ||||
| Utah | 11 | 1 | 10 | 7 | 4 | ||||
| West Virginia | 12 | -1 | 13 | 2 | 10 | ||||
| Wyoming | 22 | 0 | 22 | 5 | 17 | ||||
| Major Basin Variances | This Week | +/- | Last Week | +/- | Year Ago | ||||
| Ardmore Woodford | 1 | 0 | 1 | 1 | 0 | ||||
| Arkoma Woodford | 8 | 0 | 8 | 3 | 5 | ||||
| Barnett | 5 | 0 | 5 | 2 | 3 | ||||
| Cana Woodford | 73 | 7 | 66 | 33 | 40 | ||||
| DJ-Niobrara | 26 | 0 | 26 | 10 | 16 | ||||
| Eagle Ford | 67 | 2 | 65 | 29 | 38 | ||||
| Fayetteville | 0 | 0 | 0 | -1 | 1 | ||||
| Granite Wash | 10 | 0 | 10 | 0 | 10 | ||||
| Haynesville | 38 | 0 | 38 | 17 | 21 | ||||
| Marcellus | 42 | 0 | 42 | 7 | 35 | ||||
| Mississippian | 5 | 0 | 5 | 3 | 2 | ||||
| Permian | 386 | 6 | 380 | 168 | 218 | ||||
| Utica | 29 | -1 | 30 | 13 | 16 | ||||
| Williston | 48 | 0 | 48 | 13 | 35 | ||||
-----
Earlier:
USA:
|
CANADA:
|
||||

2017, November, 7, 12:05:00
U.S. RIGS DOWN 11 TO 898U.S. Rig Count is up 329 rigs from last year's count of 569, with oil rigs up 279, gas rigs up 52, and miscellaneous rigs down 2 to 2. Canada Rig Count is up 38 rigs from last year's count of 154, with oil rigs up 24 and gas rigs up 14.
|

2017, November, 9, 13:30:00
WORLDWIDE RIG COUNT DOWN 4 TO 2,077The worldwide rig count for October 2017 was 2,077, down 4 from the 2,081 counted in September 2017, and up 457 from the 1,620 counted in October 2016. |
||||

2017, October, 30, 11:05:00
U.S. OIL LOSERSExxonMobil and Chevron, the two largest US oil and gas groups, are continuing to lose money on oil and gas production in their home country, in spite of the rise in commodity prices since last year.
|

2017, October, 18, 18:35:00
CANADA'S OIL PRICE: $50 - $53According to the U.S. Energy Information Administration, Canada's largest energy customer has boosted domestic oil production from less than four million barrels per day in 2008 to 9.2 million bpd now, while gas output has risen from 67 million cubic feet per day to 89 million cf/d.
|
||||

2017, October, 30, 11:00:00
U.S. RIGS DOWN 4 TO 909U.S. Rig Count is up 352 rigs from last year's count of 557, with oil rigs up 296, gas rigs up 58, and miscellaneous rigs down 2 to 0. Canada Rig Count is up 38 rigs from last year's count of 153, with oil rigs up 23 and gas rigs up 15.
|

2017, October, 6, 12:30:00
TRANSCANADA'S CAPITAL PROGRAM: $24 BLNWe will continue to focus on our $24 billion near-term capital program which is expected to generate growth in earnings and cash flow to support an expected annual dividend growth rate at the upper end of an eight to 10 per cent range through 2020.
|
||||

2017, October, 18, 18:55:00
U.S. OIL + 81 TBD, GAS + 827 MCFDEIA - Crude oil production from the major US onshore regions is forecast to increase 81,000 b/d month-over-month in November to 6.12 million b/d.
|

2017, October, 9, 21:35:00
WORLDWIDE RIG COUNT DOWN 35Baker Hughes, a GE company (NYSE:BHGE) announced today that the Baker Hughes international rig count for September 2017 was 931, down 21 from the 952 counted in August 2017, and down 3 from the 934 counted in September 2016. The international offshore rig count for September 2017 was 190, down 11 from the 201 counted in August 2017, and down 31 from the 221 counted in September 2016.
|
||||

2017, October, 13, 12:50:00
U.S. OIL FOR ASIAA fresh wave of North American crude cargoes could reach the Far East in the coming months, with an estimated 6 million barrels or more of light sweet US grades loading in November expected to find a home in Asia as regional end-users step up efforts to find cheaper feedstocks amid sustained strength in the Middle Eastern crude complex, Asian trade sources said.
|

2017, September, 29, 12:10:00
CANADA NEED $60“Fifty-dollar WTI is not high enough to support a material uptick in oilsands investments,” said Randy Ollenberger, managing director of oil and gas equity research for BMO Capital Markets. “Sustained US$60-plus oil prices are required to support most projects.”
|
||||

2017, October, 4, 23:45:00
GAS IS ESSENTIALAPI - “The increased use of natural gas in electric power generation has not only enhanced the reliability of the overall system, but it has also provided significant environmental and consumer benefits. |

2017, August, 3, 12:10:00
CANADIAN DRILLING UPThe Petroleum Services Association of Canada (PSAC) has updated its 2017 Canadian Drilling Activity Forecast to reflect an increase in its projected total number of wells to be drilled during the year to 7,200 from 6,680.
|
||||

2017, September, 29, 12:25:00
U.S. HIGHEST PELROLEUM DEMANDTotal petroleum deliveries in August moved up by 1.3 percent from August 2016 to average 20.5 million barrels per day. These were the highest August deliveries in 10 years, since 2007. Compared with July, total domestic petroleum deliveries, a measure of U.S. petroleum demand, decreased 0.6 percent.
|

2017, July, 19, 14:40:00
CANADA'S ECONOMY UP 4%IMF: Canada’s economy expanded at an annual pace of nearly 4 percent in the first quarter of 2017—the fastest growth rate among the Group of 7 countries. With the economy’s adjustment to lower oil prices almost complete, growth is expected to accelerate to 2.5 percent this year, up from 1.5 percent in 2016.
|


