2017-07-12 14:30:00
OIL&GAS PRICES FORECAST: $51-$52; $3.1-$3.4
EIA - SHORT-TERM ENERGY OUTLOOK
Forecast Highlights
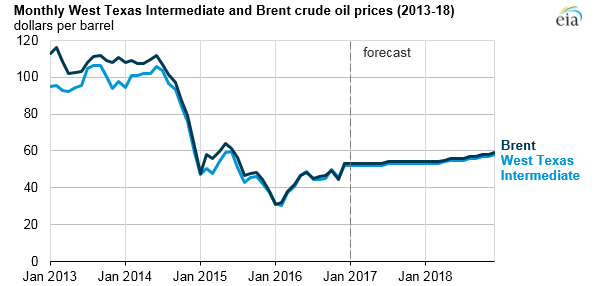
Benchmark North Sea Brent crude oil spot prices averaged $46 per barrel (b) in June, a $4/b decrease from the May average and the lowest monthly average since November of last year when prices averaged $45/b.
Brent crude oil prices are forecast to average $51/b in 2017 and $52/b in 2018, $2/b and $4/b lower than projected in last month's STEO, respectively. Average West Texas Intermediate (WTI) crude oil prices are forecast to be $2/b lower than the Brent price in both 2017 and 2018. NYMEX contract values for October 2017 delivery that traded during the five-day period ending July 6 suggest that a range of $36/b to $60/b encompasses the market expectation for WTI prices in October 2017 at the 95% confidence level.
U.S. crude oil production averaged an estimated 8.9 million barrels per day (b/d) in 2016 and is forecast to average 9.3 million b/d in 2017. EIA forecasts production to average 9.9 million b/d in 2018, which would mark the highest annual average production in U.S. history, surpassing the previous record of 9.6 million b/d set in 1970.
Dry natural gas production is forecast to average 73.3 billion cubic feet per day (Bcf/d) in 2017, a 1.0 Bcf/d increase from the 2016 level. Forecast dry natural gas production increases by an average of 3.1 Bcf/d in 2018.
Henry Hub natural gas spot prices are forecast to average $3.10 per million British thermal units (MMBtu) in 2017 and $3.40/MMBtu in 2018, compared with a 2016 average of $2.51/MMBtu, which was the lowest annual average price since 1999.
Crude Oil Prices
The monthly average spot price of Brent crude oil decreased by $4 per barrel (b) in June to $46/b, marking the first month of 2017 in which Brent crude oil spot prices averaged below $50/b. The return of 0.1 million b/d of combined crude oil production in Libya and Nigeria contributed to lower oil prices in June, as did builds in total U.S. crude oil and petroleum products inventories that were above the five-year average during the weeks ending June 2 and June 9. Also, Brent crude oil spot prices declined by nearly 5% in late May following the news of the OPEC agreement that extended production cuts through the first quarter of 2018, as some market participants had anticipated more aggressive cuts.
EIA forecasts the annual average Brent crude oil spot price to be $51/b in 2017 and $52/b in 2018. Global oil inventories are forecast to be relatively unchanged in the second half of 2017 before returning to average inventory builds of 0.2 million b/d in 2018. Given this expectation of relative balance in the global oil market through the forecast period, Brent crude oil spot prices are expected to remain fairly flat in the coming months.
EIA forecasts the Brent price to average $50/b during the second half of 2017 and first half of 2018. Daily and monthly average prices could vary significantly from this target, because global economic developments and geopolitical events in the coming months have the potential to push oil prices higher or lower than the current STEO price forecast.Uncertainty remains regarding the duration of, and adherence to, the current OPEC production cuts, which could influence prices in either direction. Also, the U.S. tight oil sector continues to be dynamic, and quickly evolving trends in this sector could affect both current prices and expectations for future prices. However, lasting upward and downward price movements could be limited over the next year because U.S. tight oil producers have locked in higher production levels at the higher oil prices seen in early 2017.
Some upward price pressures could emerge in the second half of 2018 if global oil inventories decline during that period and if the market expects global oil inventory withdrawals heading into 2019. EIA forecasts Brent crude oil prices to average $53/b during the second half of 2018, with prices rising to $55/b by the end of 2018.

Average West Texas Intermediate (WTI) crude oil prices are forecast to be $2/b lower than Brent prices in 2017 and in 2018. The slight price discount of WTI to Brent in the forecast is based on the assumption that rising U.S. crude oil production will result in WTI-priced U.S. crude oil exports competing with international volumes priced off of Brent in global crude oil markets.
The current values of futures and options contracts suggest uncertainty in the oil price outlook. WTI futures contracts for October 2017 delivery that were traded during the five-day period ending July 6 averaged $46/b, and implied volatility averaged 29%. These levels established the lower and upper limits of the 95% confidence interval for the market's expectations of monthly average WTI prices in October 2017 at $36/b and $60/b, respectively. The 95% confidence interval for market expectations widens slightly over time, with lower and upper limits of $32/b and $67/b for prices in December 2017. In July 2016, WTI for October 2016 delivery averaged $49/b, and implied volatility averaged 37%, with the corresponding lower and upper limits of the 95% confidence interval at $35/b and $67/b.
Natural Gas Prices

Henry Hub spot prices have been relatively flat in 2017, averaging $3.04 per million British thermal units (MMBtu) during the first half of the year, which is the same as the fourth quarter of 2016 average price. Prices averaged $2.98/MMBtu in June. Closer-to-normal winter temperatures are expected this winter following last year's warm winter, which contributes to growth in residential and commercial consumption. Also, export growth is forecast to increase in the second half of 2017 and in 2018. Both factors could contribute to modest upward price pressure. Forecast Henry Hub natural gas spot prices average $3.10/MMBtu in 2017 and $3.40/MMBtu in 2018.
Natural gas futures contracts for October 2017 delivery that were traded during the five-day period ending July 6 averaged $2.98/MMBtu. Current options and futures prices indicate that market participants place the lower and upper bounds for the 95% confidence interval for October 2017 contracts at $2.17/MMBtu and $4.08/MMBtu, respectively. Last year at this time, the natural gas futures contracts for October 2016 delivery averaged $2.88/MMBtu, and the corresponding lower and upper limits of the 95% confidence interval were $2.00/MMBtu and $4.14/MMBtu, respectively.
Global Liquid Fuels

EIA estimates that global petroleum and other liquid fuels inventory builds averaged 0.3 million barrels per day (b/d) in 2016, marking the third consecutive year of inventory builds. However, global oil markets are expected to be in closer balance during the next 18 months. Global liquid fuels inventories are expected to decline by an average of 0.1 million b/d in 2017 and to increase by an average of 0.2 million b/d in 2018.
Global Petroleum and Other Liquid Fuels Consumption

Global consumption of petroleum and other liquid fuels averaged 96.9 million b/d in 2016, an increase of 1.5 million b/d from the 2015 level. Consumption growth is expected to be 1.5 million b/d in 2017 and 1.6 million b/d in 2018, with 1.2 million b/d of the growth in both years coming from countries outside of the Organization for Economic Cooperation and Development (OECD). Forecast growth in the consumption of hydrocarbon gas liquids (HGL) is an important driver of overall growth in global liquid fuels consumption.
China and India are expected to be the largest contributors to non-OECD liquid fuels consumption growth. China's consumption growth is forecast to average more than 0.3 million b/d in both 2017 and 2018, and it is driven by increased use of gasoline, jet fuel, and HGL. Last year's significant rise in the use of HGL in China will continue through 2017 and 2018, albeit at a reduced pace, as new propane dehydrogenation (PDH) plants contribute to rising propane use. Diesel consumption, which declined in 2016 as a result of a slowdown in industrial activity, is expected to be largely unchanged in the forecast.
In India, liquid fuels consumption is forecast to grow by 0.2 million b/d in 2017 and by almost 0.3 million b/d in 2018. The growth is expected to result from increased use of transportation fuels, of naphtha and ethane feedstock for new petrochemical projects, and of propane for residential purposes. The Indian government's currency demonetization program in late 2016 contributed to declines in India's oil consumption in the first quarter of 2017. However, as India's oil consumers adjusted to the currency changes, liquid fuels consumption began growing again in the second quarter of 2017.
For non-OECD countries excluding China and India, liquid fuels consumption is forecast to increase by about 0.6 million b/d in both 2017 and 2018. The Middle East and Africa are expected to account for most of this growth, which is expected to be partially offset by declining liquid fuels consumption in Brazil.
OECD petroleum and other liquid fuels consumption rose by 0.4 million b/d in 2016. In 2017, EIA forecasts OECD consumption growth to average 0.3 million b/d, as consumption growth in Europe slows. For 2017, forecast liquid fuels consumption growth of 0.3 million b/d in the United States, including 0.1 million b/d of HGL, and 0.1 million b/d in Europe is partially offset by declining consumption in Japan.
In 2018, OECD consumption growth is expected to return to 0.4 million b/d, with the United States accounting for nearly all of this increase. Forecast U.S. growth is mainly the result of increased use of HGL, which is expected to increase by almost 0.3 million b/d. Rising ethane consumption accounts for almost all of this increase, as new ethane crackers are expected to come online during the forecast period.
Non-OPEC Petroleum and Other Liquid Fuels Supply


EIA estimates that petroleum and other liquid fuels production in countries outside of the Organization of the Petroleum Exporting Countries (OPEC) decreased by 0.6 million b/d in 2016, with more than half of the decrease occurring in North America. However, EIA expects non-OPEC production to rise by 1.0 million b/d in 2017 and by 1.2 million b/d in 2018, as total U.S. liquid fuels production increases by 0.8 million b/d and by 1.0 million b/d, in those respective years, in response to rising oil prices and increases in drilling productivity.
Among non-OPEC producers, other than the United States, declining liquids production in some areas is expected to be countered by rising production in other areas, with total liquid fuels production rising by 0.2 million b/d in both 2017 and 2018. Some of the largest declines are expected to be in Mexico and in China. However, EIA expects production growth in Canada, Brazil, and Kazakhstan to contribute to overall non-OPEC increases.
Growth in Canada's total liquid fuels production is expected to average 0.2 million b/d in 2017 and 0.1 million b/d in 2018. This growth reflects new oil sands projects beginning operation at Meadow Creek and Kirby North and the expansion of oil sands operations at several other projects.
Growth in Brazil's total liquid fuels production is expected to average 0.2 million b/d in 2017 and 0.1 million b/d in 2018. Brazil's production growth is expected to be driven by the commissioning of a number of floating production, storage, and offloading (FPSO) facilities in the presalt fields in the Santos basin. In May, Petrobras began operations at the P-66 FPSO, which added 150,000 b/d of production capacity at the Lula South presalt field. In addition, Petrobras plans to start production at the P-67 FPSO at the Lula North field in the third quarter of 2017, and several other FPSO facilities are expected to come online in 2018.
Kazakhstan is expected to be a notable source of non-OPEC production growth throughout the forecast period, with increases in annual average production projected to be 0.2 million b/d and 0.1 million b/d in 2017 and 2018, respectively. The increase in output is the result of rising production at the giant Kashagan field.
Non-OPEC unplanned production outages in June were about 0.6 million b/d, which is 0.1 million b/d lower than the May level, as Canadian oil production returned following fire-related outages at a Syncrude oil production facility in Alberta. Outages during the first half of 2017 averaged almost 0.6 million b/d, about 0.1 million b/d higher than the 2016 average.
OPEC Petroleum and Other Liquid Fuels Supply

Starting with this STEO, both historical and forecast OPEC production values include Equatorial Guinea. In the first half of 2017, Equatorial Guinea produced about 130,000 b/d of crude oil on average.
OPEC crude oil production averaged 32.7 million b/d in 2016, an increase of 1.0 million b/d from 2015, led by rising production in Iran, Iraq, and, to a lesser extent, Saudi Arabia. OPEC crude oil production is expected to fall by 0.2 million b/d in 2017, as OPEC members have limited production based on the November 2016 agreement. In May 2017, this agreement was extended through the first quarter of 2018. EIA's forecast assumes a further extension of the agreement in 2018 but with lesser compliance. Without a further extension of the agreement, EIA would expect larger inventory builds in 2018 than are included in this forecast.
EIA expects that OPEC crude oil output will rise by 0.5 million b/d in 2018, driven by an increase in output in Iraq. The increase in Iraq's production in 2018 is expected to result from production coming online that was previously scheduled for 2017.
In both 2017 and 2018, EIA expects crude oil production to increase in Libya and Nigeria, which are countries not covered by the supply reduction agreement. In Libya, previously shut-in fields have seen rapid increases in output since the third quarter of 2016. Libya's production reached more than 1.0 million b/d in early July.
OPEC noncrude liquids production averaged 6.6 million b/d in 2016 and is forecast to increase by 0.4 million b/d in 2017 and by 0.2 million b/d in 2018, led by increases in Iran and Qatar.
OPEC unplanned crude oil supply disruptions averaged nearly 1.4 million b/d in June, down almost 0.2 million b/d from the May level. Outages in Libya decreased in June because of the reopening and continued ramp-up of the oil fields in the country. Although Libya's production trajectory has been mostly upward, output during May and June were volatile, with unplanned maintenance, industrial action, and power failures all contributing to outages. Nonetheless, Libya's crude oil production averaged 0.9 million b/d in June, the highest level since October 2014.
Unplanned oil production outages in Nigeria also decreased in June, as Forcados crude oil resumed production following nearly six months offline. Forcados production is typically about 0.2 million b/d, and although cargoes have begun loading Forcados crude oil, EIA expects the full return of the stream to occur sometime in the fourth quarter of 2017. For June 2017, EIA estimates that roughly half of the Forcados volume resumed production.
Average OPEC surplus crude oil production capacity is expected to be 2.1 million b/d in 2017 and 1.4 million b/d in 2018. Surplus capacity is typically an indicator of market conditions, and surplus capacity below 2.5 million b/d indicates a relatively tight oil market. However, high current and forecast levels of global oil inventories make the forecast low surplus capacity less significant.
OECD Petroleum Inventories

EIA estimates that OECD commercial crude oil and other liquid fuels inventories were 2.97 billion barrels at the end of 2016, equivalent to roughly 65 days of consumption. Forecast OECD inventories rise to 2.99 billion barrels at the end of 2017 and to 3.03 billion barrels at the end of 2018.
U.S. Economic Assumptions


Recent Economic Indicators
Real gross domestic product (GDP) increased at an annual rate of 2.1% in the fourth quarter of 2016 and 1.4% in the first quarter of 2017, according to the recent estimates released by the Bureau of Economic Analysis. The deceleration in real GDP in the first quarter primarily reflected a downturn in private inventory investment and a deceleration in personal consumption expenditures that were partly offset by an upturn in exports and an acceleration in nonresidential fixed investment.
Production, Income, and Employment
EIA used the June 2017 version of the IHS Markit macroeconomic model with EIA's energy price forecasts as model inputs to develop the economic projections in the STEO.
Real GDP is projected to increase 2.3% in 2017 and 2.6% in 2018 compared with the 1.6% increase in 2016. Real disposable income is projected to grow by 2.1% in 2017 and by 3.6% in 2018 compared with a 2.6% increase in 2016. Total industrial production is projected to increase by 2.2% in 2017 and by 2.8% in 2018, compared with a 1.2% decline in 2016. Projected growth in nonfarm employment averages 1.4% in 2017 and 1.1% in 2018, compared with growth of 1.8% in 2016.
Expenditures
Private real fixed investment is projected to grow by 5.2% in 2017 and by 4.3% in 2018, compared with 0.7% growth in 2016. Real consumption expenditures are projected to grow by 2.5% in 2017 and by 3.0% in 2018, compared with a 2.7% increase in 2016.
Exports are projected to grow by 2.4% in 2017 and by 2.1% in 2018, compared with 0.4% growth in 2016. Imports are projected to grow by 3.8% in 2017 and by 5.5% in 2018, compared with 1.1% growth in 2016. Total government expenditures are projected to increase by 0.1% in 2017 and by 0.9% in 2018, compared with 0.8% growth in 2016.
-----
Earlier:
|
PRICES: |
|
MARKETS: |
|
|
||
|
|
||
|
|
||
|
|
||
|
|
||
|
|
||
|
|
||
|
CHINA: |
|
INDIA: |
|
|
||
|
|
||
|
|
||
|
|
||
|
|
||
|
|
||
|
|
||
|
OPEC: |
|
USA: |
|
|
||
|
|
||
|
|
||
|
|
||
|
|
||
|
|
||
|
|
||
|
|
|
|


