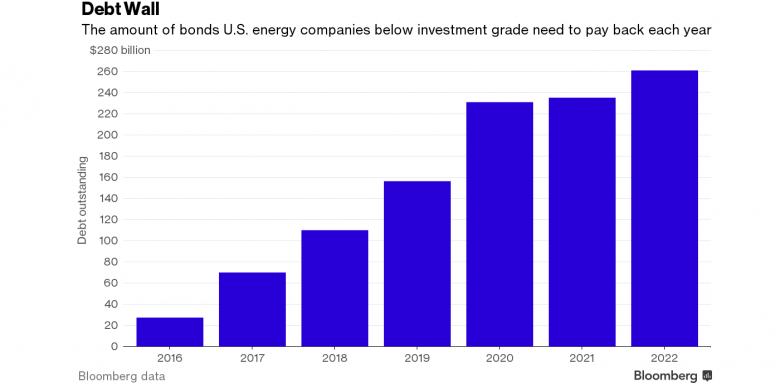
U.S. OIL DEBT

EIA - EIA's review of first-quarter 2017 financial results for 54 publicly traded U.S. oil and gas producers indicates that these companies, in aggregate, are paying off debt while funding investment through the sale of assets and the issuance of equity. In recent years, investment had been more heavily funded through the issuance of debt. Although revenue for these companies has grown over the past year with higher oil prices, net cash from operations has grown more slowly because of increased upstream costs.
The 54 companies included in the analysis are listed on U.S. stock exchanges and are required to submit financial reports to the U.S. Securities and Exchange Commission. They operate largely in U.S. onshore basins, but some also have operations in the Federal Offshore Gulf of Mexico, Alaska, and various other regions across the globe. Aggregate global crude oil and other liquids production for these companies averaged 5.3 million barrels per day (b/d) during the first quarter of 2017.
For these publicly traded companies, capital expenditures on exploration and development totaled $16 billion in the first quarter of 2017. This level is $8 billion lower than the 2012–16 quarterly average spending related to these activities by these companies, but is almost $3 billion higher than the first quarter of 2016. Many companies have announced that they expect to increase full-year 2017 capital expenditures when compared with 2016 levels by adding rigs for drilling new wells across various basins.
Capital expenditures can be funded from cash from operating activities, the assumption of debt (bank financing or bonds), the issuance of equity, or asset sales. From 2012 through the end of 2015, debt was a significant source of capital for the producers included in the analysis, with the addition of a cumulative $55.3 billion in net debt. Since the beginning of 2016, however, these producers have reduced debt by $1.4 billion (Figure 1). The combination of higher equity and lower debt has resulted in the long-term debt-to-equity ratio, a measure of financial leverage, declining from 88% to 80% for the group of companies as a whole between the first quarter of 2016 and the first quarter of 2017.
Companies raised a considerable amount of cash from the sale of assets in the first quarter of 2017, the largest for any quarter since the third quarter of 2014 and nearly three times the quarterly average during 2015–16 (Figure 2). For example, Anadarko Petroleum sold $2.3 billion of Eagle Ford assets to Sanchez Energy and Blackstone Group, a private equity firm. Three other companies raised over $500 million each through asset sales in the first quarter of 2017. ConocoPhillips also recently announced large sales of Canadian oil sands assets as well as U.S. natural gas properties that will likely be finalized over the course of 2017, suggesting that asset sales will remain a significant source of cash. Companies often favor asset sales when they wish to restructure their production portfolios and invest where they believe they have more of a competitive advantage.
Net cash from operations, the largest source of cash for these companies, has increased in recent quarters as West Texas Intermediate (WTI) crude oil prices increased to an average of $51.78 per barrel in the first quarter of 2017, the highest price since the second quarter of 2015. Although higher prices increased revenue, higher costs and taxes restrained growth in the net amount of cash generated from operations relative to the increase in revenue. These trends could require some companies to reduce capital expenditures or seek other sources of cash, including the sale of assets or the issuance of debt or equity, in future quarters.
The difference between revenue and net cash from operations per barrel of oil equivalent (boe) grew from $18.06/boe in the first quarter of 2016 to $23.32/boe in the first quarter of 2017 (Figure 3). In other words, approximately one-third of the year-over-year increase in revenue per boe (from $23.15/boe in the first quarter of 2016 to $37.88/boe in the first quarter of 2017) has been needed to pay for increased cash expenses. The financial statements reveal that two of the largest increases in cash expenses were income taxes and costs of goods sold, increasing year-over-year by $6.26/boe and $2.74/boe, respectively. An additional consideration, however, is that a majority of these companies have only paid income taxes in the past quarter when they began generating net operating profits, an improvement in financial performance compared with 2015 and 2016 when the majority of these companies operated with net losses.
-----
Earlier:


