2017-07-10 12:01:00
U.S. RIGS UP 12 TO 952
U.S. Rig Count is up 12 rigs from last week to 952, with oil rigs up 7 to 763 and gas rigs up 5 to 189.
U.S. Rig Count is up 512 rigs from last year's count of 440, with oil rigs up 412, gas rigs up 101, and miscellaneous rigs down 1 to 0.
The U.S. Offshore Rig Count is unchanged from last week at 21 and up 2 rigs year over year.
Canadian Rig Count is down 14 rigs from last week to 175, with oil rigs down 7 to 105 and gas rigs down 7 to 70.
Canadian Rig Count is up 94 rigs from last year's count of 81, with oil rigs up 68, gas rigs up 27, and miscellaneous rigs down 1 to 0.
| Week | Year | ||||||||
| Location | Week | +/- | Ago | +/- | Ago | ||||
| Land | 927 | 12 | 915 | 510 | 417 | ||||
| Inland Waters | 4 | 0 | 4 | 0 | 4 | ||||
| Offshore | 21 | 0 | 21 | 2 | 19 | ||||
| United States Total | 952 | 12 | 940 | 512 | 440 | ||||
| Gulf Of Mexico | 21 | 0 | 21 | 3 | 18 | ||||
| Canada | 175 | -14 | 189 | 94 | 81 | ||||
| North America | 1127 | -2 | 1129 | 606 | 521 | ||||
| U.S. Breakout Information | This Week | +/- | Last Week | +/- | Year Ago | ||||
| Oil | 763 | 7 | 756 | 412 | 351 | ||||
| Gas | 189 | 5 | 184 | 101 | 88 | ||||
| Miscellaneous | 0 | 0 | 0 | -1 | 1 | ||||
| Directional | 74 | 3 | 71 | 38 | 36 | ||||
| Horizontal | 804 | 12 | 792 | 461 | 343 | ||||
| Vertical | 74 | -3 | 77 | 13 | 61 | ||||
| Canada Breakout Information | This Week | +/- | Last Week | +/- | Year Ago | ||||
| Oil | 105 | -7 | 112 | 68 | 37 | ||||
| Gas | 70 | -7 | 77 | 27 | 43 | ||||
| Miscellaneous | 0 | 0 | 0 | -1 | 1 | ||||
| Major State Variances | This Week | +/- | Last Week | +/- | Year Ago | ||||
| Alaska | 8 | 4 | 4 | 0 | 8 | ||||
| Arkansas | 1 | 0 | 1 | 1 | 0 | ||||
| California | 11 | 0 | 11 | 6 | 5 | ||||
| Colorado | 36 | 0 | 36 | 17 | 19 | ||||
| Kansas | 0 | 0 | 0 | -1 | 1 | ||||
| Louisiana | 69 | 2 | 67 | 26 | 43 | ||||
| New Mexico | 59 | -1 | 60 | 38 | 21 | ||||
| North Dakota | 52 | 0 | 52 | 24 | 28 | ||||
| Ohio | 27 | 0 | 27 | 15 | 12 | ||||
| Oklahoma | 136 | 4 | 132 | 77 | 59 | ||||
| Pennsylvania | 34 | 0 | 34 | 21 | 13 | ||||
| Texas | 463 | 2 | 461 | 262 | 201 | ||||
| Utah | 7 | -1 | 8 | 3 | 4 | ||||
| West Virginia | 13 | 0 | 13 | 2 | 11 | ||||
| Wyoming | 25 | 0 | 25 | 17 | 8 | ||||
| Major Basin Variances | This Week | +/- | Last Week | +/- | Year Ago | ||||
| Ardmore Woodford | 1 | 0 | 1 | 1 | 0 | ||||
| Arkoma Woodford | 10 | 1 | 9 | 8 | 2 | ||||
| Barnett | 7 | 0 | 7 | -2 | 9 | ||||
| Cana Woodford | 63 | 4 | 59 | 35 | 28 | ||||
| DJ-Niobrara | 27 | 0 | 27 | 12 | 15 | ||||
| Eagle Ford | 84 | 0 | 84 | 51 | 33 | ||||
| Fayetteville | 1 | 0 | 1 | 1 | 0 | ||||
| Granite Wash | 14 | 2 | 12 | 6 | 8 | ||||
| Haynesville | 43 | 2 | 41 | 26 | 17 | ||||
| Marcellus | 45 | 0 | 45 | 22 | 23 | ||||
| Mississippian | 6 | -1 | 7 | 1 | 5 | ||||
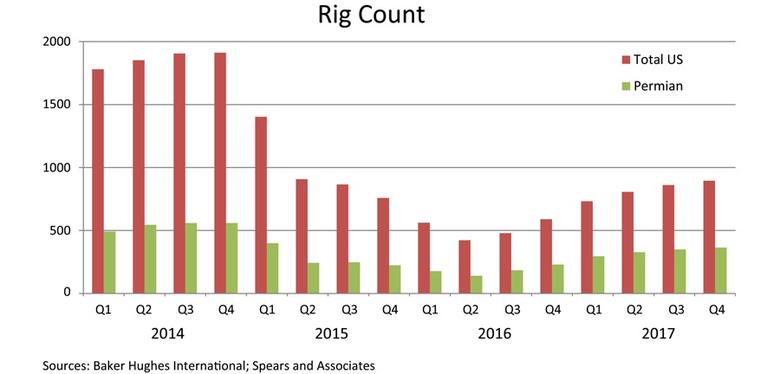
| Permian | 369 | -1 | 370 | 211 | 158 | ||||
| Utica | 28 | 0 | 28 | 16 | 12 | ||||
| Williston | 52 | 0 | 52 | 24 | 28 | ||||
-----
Earlier:


