2017-08-14 14:30:00
OIL STOCKS DOWN BY 500 TBD
OGJ - Global oil stocks fell by 500,000 b/d and preliminary data for July, particularly in the US where stocks fell by 790,000 b/d, is supportive of rebalancing supplies with demand, according to the most recent Oil Market Report from the International Energy Agency.
However, "we must not forget that they are falling from a very great height in volume terms," IEA said. As an exercise, if stocks from members of the Organization for Economic Cooperation and Development fell by 500,000 b/d until the end of first-quarter 2018 when the current output agreements expire, levels would still be 60 million bbl above the 5-year average.
"There would be more confidence that rebalancing is here to stay if some producers party to the output agreements were not, just as they are gaining the upper hand, showing signs of weakening their resolve," IEA said in the report.
The compliance rate with the Organization of Petroleum Exporting Countries' production-cut agreement fell again in July to a new low of 75% from June's revised figure of 77%. For those non-OPEC countries acting in support, their compliance rate in July was 67%. Together, the twenty-two countries are producing about 470,000 b/d in excess of their commitment.
Meanwhile, oil demand this year is expected to be stronger than first thought. IEA's growth estimate for 2017 has been increased to 1.5 million b/d, including very strong data for the year's second quarter when demand increased by 1.8 million b/d.
Notably, in this report, the agency has incorporated new IEA World Energy Statistics (WES) annual data for non-OECD countries, rebasing world demand from 2015. In addition, IEA changed methodology for the two largest non-OECD countries—China and India. As a result, IEA's estimate of global oil demand has been revised substantially downward. By contrast, the growth in oil demand for 2017 and 2018 is only slightly changed.
Brent crude oil prices have recently stabilized above $50/bbl following a period a few weeks ago when, as IEA said in last month's OMR, there was "waning confidence" in the market.
Demand
Preliminary estimates of year-over-year global oil demand growth remain strong in the second quarter, reaching 1.8 million b/d, or 1.9%. Estimates of global oil product demand growth in 2017 have been revised upward by 100,000 b/d compared with last month's report, to 1.5 million b/d.
OECD growth continues to be stronger than expected, with solid gains in Germany and the US.
The US Department of Energy for May shows demand growth of 820,000 b/d year-over-year—the highest level for May recorded since 2007. Gasoline demand was up 155,000 b/d in May, in line with vehicle miles travelled (VMT) increases. Gas oil demand rose 225,000 b/d year-over-year, benefiting from manufacturing production growth and increased freight transportation.
Meanwhile, European oil demand in May has been revised downward by 125,000 b/d compared with last month's report as hard data became available. Demand is nevertheless reported to have increased by 500,000 b/d year-over-year during the month.
European demand growth slowed to 290,000 b/d in June, according to preliminary data. However, German oil consumption rose by 140,000 b/d year-over-year in June, supported by a jump of 150,000 b/d in gas oil deliveries.
Among non-OECD countries, China's oil demand has risen strongly since the start of this year, increasing 650,000 b/d year-over-year in the first half. It is a substantial acceleration of growth following an increase of just 300,000 b/d in 2016, supported by higher demand for LPG, gasoline, and gas oil.
In June, Chinese oil demand growth slowed to 500,000 b/d year-over-year after a very strong growth of 915,000 b/d in May.
Indian demand growth slowed to 70,000 b/d in June after a strong May, when the country's demanded rose by 285,000 b/d. LPG and gas oil demand remained strong while kerosene demand was subdued.
Supply
Global oil supply climbed by 520,000 b/d in July to 98.16 million b/d as non-OPEC and OPEC continued to increase production. A third straight month of gains pushed supply up 500,000 b/d vs. a year ago.
OPEC crude output rose by 230,000 b/d in July to a new 2017 high of 32.84 million b/d, boosted by a dramatic recovery in Libya, which is exempt from supply cuts. Output from the 12 members restricted by the output pact edged up, weakening compliance to 75%, the lowest rate this year.
Libya's recent strong performance and Nigeria's continued recovery account for 70% of a 960,000 b/d increase in total OPEC output since March. This means that production from OPEC as a whole has been cut by only 230,000 b/d.
Supply from Saudi Arabia during July held at 10.05 million b/d, the highest level this year and just slightly below its output target, in order to meet increased internal demand. For August, a sharp drop in exports is planned, with Saudi Energy Minister Khalid al-Falih signaling that shipments would be limited to 6.6 million b/d in order to satisfy peak domestic demand for power generation while also meeting its OPEC target.
Non-OPEC oil supply rose 200,000 b/d to 58.3 million b/d in July as Canadian output recovered from outages and US crude production continued to trend higher. Gains also were seen in Brazil and Kazakhstan, lifting total output 510,000 b/d above a year ago. Compliance with agreed output curbs improved to 67% from a downwardly revised June level of 66%.
The forecast for non-OPEC supply growth for 2017 and 2018 is largely unchanged since last month's OMR, rising 700,000 b/d and 1.4 million b/d, respectively. The US is expected to account for the bulk of the gains in both years, increasing 600,000 b/d on average this year and by just over 1 million b/d in 2018.
A slump in oil prices since the start of the year has led major US oil producers to scale back spending plans for 2017 even as they intend to pump more oil.
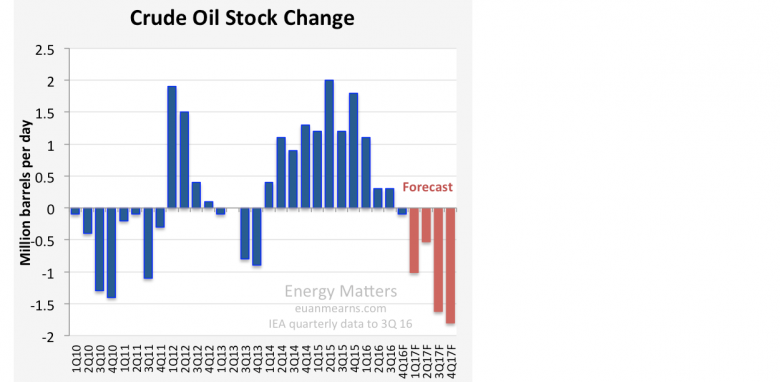
Stocks
OECD industry stocks fell in June by 19.2 million bbl to 3.021 million bbl on strong refinery runs and oil product exports to non-OECD countries. OECD industry stocks fell 9.2 million bbl in the second quarter, relative to end first quarter levels, showing a counter-seasonal trend.
IEA said global oil stocks are likely to have drawn moderately in this year's second quarter as declines in the OECD, oil in transit volumes, Fujairah, Singapore, and Chinese commercial stocks more than offset builds elsewhere.
Preliminary data show a further drop in stocks in July in the US and Fujairah. Floating storage volumes also fell, whereas stocks in Europe, Japan, and Singapore increased.
-----
Earlier:
U.S. OIL INVENTORIES UP 2.8 MBL


