U.S. GAS UP TO 1.9%

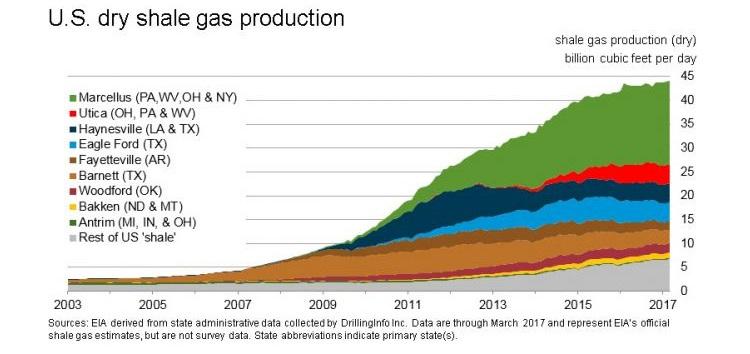
EIA - In June 2017, for the first time in 15 months, dry natural gas production increased year-to-year from the same month a year ago. The preliminary level for dry natural gas production in June 2017 was 2,188 billion cubic feet (Bcf), or 72.9 Bcf/day. This level was a 1.3 Bcf/day (1.9%) increase from the June 2016 level of 71.6 Bcf/day.
The estimated natural gas consumption level in June 2017 was 1,883 Bcf, or 62.8 Bcf/day. This level was a decrease of 6.0%, or 4.0 Bcf/day, from the 2,003 Bcf consumed in June 2016. Natural gas consumption for June was the lowest for the month since 2014.
Year-over-year total consumption of dry natural gas in June 2017 increased in two of the four consuming sectors and decreased in the other two. Deliveries of natural gas by consuming sector in June 2017 were as follows:
- Residential deliveries in June 2017 were 123.9 Bcf, or 4.13 Bcf/day, up 0.4% from 4.12 Bcf/day in June 2016. Residential deliveries were the third lowest for June since EIA began tracking them in 1973.
- Commercial deliveries were 138.3 Bcf, or 4.61 Bcf/day, down 0.4% from 4.63 Bcf/day in June 2016.
- Industrial deliveries were 608 Bcf, or 20.3 Bcf/day, up 3.1% from 19.7 Bcf/day in June 2016. Industrial deliveries were the highest for June since EIA began using the current sectoral definitions introduced in 2001.
- Electric power deliveries were 834 Bcf, or 27.8 Bcf/day, down 14.1% from 32.4 Bcf/day in June 2016. Electric power deliveries were the lowest for June since 2014.
-----
Earlier:
U.S. LNG FOR EUROPE - 4U.S. LNG FOR EUROPE - 4 U.S. LNG FOR EUROPE - 4 Last week, U.S. liquefied natural gas (LNG) made its way to the somewhat unlikely market of Lithuania. The former Soviet republic traditionally bought its gas from Russian state company Gazprom; this wa ...
|
|
U.S. GAS EXPORTS WILL UPU.S. GAS EXPORTS WILL UP U.S. GAS EXPORTS WILL UP The U.S. will export more natural gas than it imports in 2017. The United States has been a net exporter for three of the past four months and is expected to continue to export more natural gas than i ...
|
|
U.S. OIL&GAS PRODUCTION WILL UP... WILL UP Crude oil production from the seven major US onshore regions is projected to rise 113,000 b/d month-over-month in August to 5.585 million b/d. Crude oil production from the seven major US onshore regions is projected to rise 113,000 b/d month ...
|
|
U.S. GLOBAL LEADERSHIP... S. GLOBAL LEADERSHIP U.S. GLOBAL LEADERSHIP While US demand for gas is rising because of higher industrial consumption, more than half of the production increase will be used for LNG for export. By 2022, IEA estimates that the US will be on course to ...
|
|
U.S. LNG FOR BRITAIN... NG FOR BRITAIN U.S. LNG FOR BRITAIN The UKs first US LNG cargo will arrive at the Isle of Grain terminal on around July 8, according to shipping sources. The UKs first US LNG cargo will arrive at the Isle of Grain terminal on around July 8, according ...
|
|
U.S. GAS UPDOWNU.S. GAS UPDOWN U.S. GAS UPDOWN Natural gas net imports (imports minus exports) set a record low of 685 billion cubic feet (Bcf) in 2016, continuing a decline for the 9th consecutive year. In recent years both U.S. natural gas production and consumpt ...
|
|
U.S. OIL GAS PRODUCTION WILL UP ANEW... UP ANEW Crude oil production from the seven major US onshore producing regions is forecast to rise 127,000 b/d month-over-month in June to average 5.475 million b/d. Gas production from the seven regions is forecast to gain 684 MMcfd month-over-month ...
|


