2018-01-10 13:05:00


OIL PRICES: $60 - $61
EIA - SHORT-TERM ENERGY OUTLOOK
Forecast Highlights
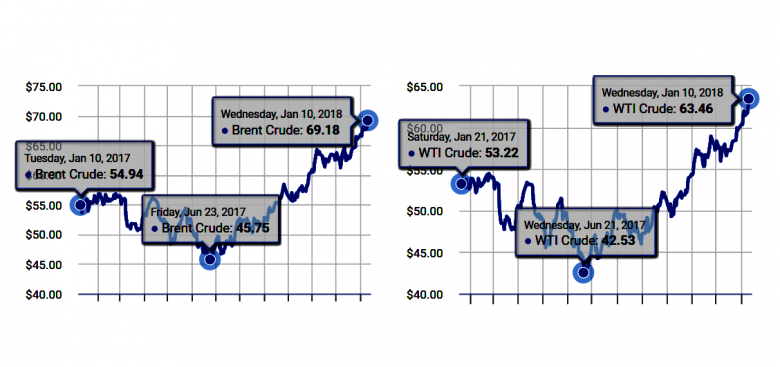
- Benchmark North Sea Brent crude oil spot prices averaged $64 per barrel (b) in December, an almost $2/b increase from the November average and the highest monthly average since November 2014.
- Brent crude oil prices averaged $54/b in 2017 and are forecast to average $60/b in 2018 and $61/b in 2019. West Texas Intermediate (WTI) crude oil spot prices are forecast to average $4/b less than Brent prices in both 2018 and 2019. EIA’s forecast for the average WTI price for December 2018 of $58/b should be considered in the context of NYMEX contract values for December 2018 delivery. NYMEX contract values traded during the five-day period ending January 4 suggest that a range of $40/b to $85/b encompasses the market expectation for WTI prices in December 2018 at the 95% confidence level.
- U.S. crude oil production averaged an estimated 9.3 million barrels per day (b/d) in 2017 and is estimated to have averaged 9.9 million b/d in December. U.S. crude oil production is forecast to average 10.3 million b/d in 2018,which would mark the highest annual average production in U.S. history, surpassing the previous record of 9.6 million b/d set in 1970. EIA forecasts production to increase to an average of 10.8 million b/d in 2019 and to surpass 11 million b/d in November 2019.
- Dry natural gas production is forecast to average 80.4 billion cubic feet per day (Bcf/d) in 2018, a 6.9 Bcf/d increase from the 2017 level, which would be the highest year-over-year increase on record. Forecast dry natural gas production increases by an average of 2.6 Bcf/d in 2019.
- Henry Hub natural gas spot prices are forecast to average $2.88 per million British thermal units (MMBtu) in 2018 and $2.92/MMBtu in 2019, compared with the 2017 average of $2.99/MMBtu. EIA’s forecast for the average Henry Hub price for December 2018 of $3.04/MMBtu should be considered in the context of NYMEX contract values for December 2018 delivery. NYMEX contract values traded during the five-day period ending January 4 suggest that a range of $1.83/MMBtu to $4.89/MMBtu encompasses the market expectation for Henry Hub prices in December 2018 at the 95% confidence level.
- Coal production increased by 45 million short tons (MMst) (6%) in 2017 in response to high demand for U.S. coal exports. Coal production is forecast to decline by 14 MMst (2%) in 2018 and by 18 MMst (2%) in 2019, as export demand is expected to slow and natural gas prices are expected to stay below $3/MMBtu during much of the forecast period, which contributes to less coal use for electricity generation.
- EIA expects the share of U.S. total utility-scale electricity generation from natural gas to rise from 32% in 2017 to 33% in 2018 and to 34% in 2019, as a result of low natural gas prices. Coal's forecast generation share falls from 30% in 2017 to slightly lower than 30% in 2018 and 28% in 2019. The nuclear share of generation was 20% in 2017 and is forecast to average 20% in 2018 and 19% in 2019. Nonhydropower renewables provided almost 10% of electricity generation in 2017, and its 2018 share is expected be similar before increasing to almost 11% in 2019. The generation share of hydropower was more than 7% in 2017 and is forecast to be slightly lower than 7% in both 2018 and 2019.
Prices
Crude Oil Prices. Brent crude oil averaged $54/barrel (b) in 2017, an increase of $10/b from 2016 levels. Prices increased fairly steadily through the second half of the year, with year-end prices higher than the annual average. Daily Brent spot prices ended 2017 near $67/b, which was the highest level since December 2014. The monthly average spot price of Brent crude oil increased by $2/b in December to $64/b, marking only the fourth time that monthly Brent crude oil prices averaged more than $60/b in the past 36 months
Most of the upward price movement in recent months reflects continuing draws in global oil inventory levels. EIA estimates that global petroleum and other liquid fuels inventories fell by an average of 0.4 million b/d in 2017, which was the first year of annual average draws since 2013. In addition, oil prices were supported by OPEC’s November 30, 2017, announcement to extend its crude oil supply reduction agreement through the end of 2018. Also, Brent prices increased in December because of a disruption to the North Sea’s Forties crude oil pipeline system early in the month. The Forties pipeline system is one of the primary distribution networks for Brent crude oil delivery in the North Sea, and its outage curtailed available supply in the near term. Trade press reports indicate the Forties pipeline system restarted operations in late December 2017.
EIA forecasts the Brent crude oil spot price will average $60/b in 2018 and $61/b in 2019. After falling in 2017, EIA expects global oil inventories to rise by 0.2 million b/d in 2018 and by 0.3 million b/d in 2019. EIA forecasts the expectation of inventory builds in 2018 and 2019 will contribute to crude oil prices declining from current levels to an average of $60/b during the first quarter of 2018. Prices are then expected to remain relatively flat through 2019.
Daily and monthly average crude oil prices could vary significantly from annual average forecasts, because global economic developments and geopolitical events in the coming months have the potential to push oil prices higher or lower than the current STEO price forecast. Uncertainty remains regarding the duration of, and adherence to, the current OPEC production cuts, which could influence prices in either direction. Also, the U.S. tight oil sector continues to be dynamic, and quickly evolving trends in this sector could affect both current crude oil prices and expectations for future prices.
Average West Texas Intermediate (WTI) crude oil prices are forecast to be $4/b lower than Brent prices in 2018 and in 2019, falling from the $6/b average price difference seen in the fourth quarter of 2017.
Global Liquid Fuels
EIA estimates that global petroleum and other liquid fuels inventory draws averaged 0.4 million barrels per day (b/d) in 2017, marking the first year of global inventory draws since 2013. EIA expects global inventories to increase by 0.2 million b/d in 2018 and by 0.3 million b/d in 2019.
The Brent crude oil spot price averaged $54/b in 2017, an increase of $10/b from 2016 levels. Daily Brent spot prices ended 2017 near $67/b, which was the highest price level since December 2014. The price increase in 2017 is consistent with the global inventory draws experienced during the year. EIA expects that the modest inventory builds forecast for 2018 and 2019 will contribute to Brent crude oil prices declining from current levels to an average of $60/b in the first quarter of 2018. Brent prices are then expected to remain relatively flat near $60/b for the remainder of the forecast period. Forecast Brent spot prices average $60/b in 2018 and $61/b in 2019.

Global Petroleum and Other Liquid Fuels Consumption. Global consumption of petroleum and other liquid fuels grew by 1.4 million b/d in 2017, reaching an average of 98.4 million b/d for the year. Although the rate of consumption growth slowed in 2017 compared with 2016, EIA expects that consumption growth will average 1.7 million b/d in 2018 and almost 1.7 million b/d 2019, driven by the countries outside of the Organization for Economic Cooperation and Development (OECD). Non-OECD consumption growth would account for 1.2 million b/d and 1.3 million b/d of the global growth in 2018 and 2019, respectively. The non-OECD petroleum and other liquid fuels consumption growth is driven by a forecast of higher growth in non-OECD oil-weighted Gross Domestic Product (GDP). Growth in non-OECD oil-weighted GDP is expected to be 4.3% in 2018 and 4.4% in 2019, up from 3.9% in 2017.
EIA expects India and China to be the largest contributors to growth in non-OECD petroleum and other liquid fuels consumption in 2018 and 2019. China’s consumption is expected to increase by 0.4 million b/d in 2018, followed by a 0.3 million b/d increase in 2019. Consumption growth in China reflects expectations of increased use of gasoline, jet fuel, and, to a lesser extent, hydrocarbon gas liquids (HGL). India, which saw slower-than-expected liquid fuels consumption growth of less than 0.1 million b/d in 2017, partly because of monetary and fiscal policy changes, is expected to experience stronger growth in 2018 and 2019, with consumption forecast to grow by about 0.3 million b/d in each year.
In addition to growth in China and India, EIA expects petroleum and other liquid fuels consumption growth in the Middle East to rise in 2018 and 2019, with increases of 0.1 million b/d in 2018 and 0.2 million b/d in 2019. Saudi Arabia continues to see increasing domestic petroleum consumption despite the expansion of natural gas use for electric power generation. EIA expects that Saudi Arabia’s direct burn of crude oil for electric power generation will remain at roughly the 2017 level throughout the forecast period.
OECD petroleum and other liquid fuels consumption increased by 0.4 million b/d in 2017, and EIA expects it will grow by 0.5 million b/d in 2018 and by 0.3 million b/d in 2019. The main driver of OECD consumption growth is the United States. In Asia and Oceania, declining consumption in Japan in 2018 and 2019 is partially offset by modest growth in other areas. Europe is expected to see modest consumption growth in 2018 followed by a small decline in 2019.

Non‐OPEC Petroleum and Other Liquid Fuels Supply. EIA estimates that petroleum and other liquid fuels production increased by 0.7 million b/d in 2017 in countries outside of the Organization of the Petroleum Exporting Countries (OPEC). Combined production growth of 1.0 million b/d in the United States and Canada more than offset a decrease of 0.3 million b/d among the rest of the non-OPEC producers.
EIA expects non-OPEC petroleum and other liquid fuels production to rise by 2.0 million b/d in 2018 and by 1.3 million b/d in 2019. The forecast production growth is centered in the Americas, as U.S. production growth is forecast to average 1.5 million b/d in in 2018 and 1.0 million b/d in 2019. Canada and Brazil are expected to contribute combined growth of 0.4 million b/d in both 2018 and 2019.


Canada's petroleum and other liquid fuels production grows by 0.3 million b/d in 2018 and by 0.2 million b/d in 2019 in EIA's forecast. In Canada, oil sands projects continue to drive production growth during the forecast period, with the new phases of the Horizon oil sands project adding production starting in November 2017. In addition, the Fort Hills project, which is planned to come online in late 2018 is also expected to contribute another 0.2 million b/d to Canada's output in 2019. In addition to production increases from oil sands, the recently-started Hebron offshore field is also expected to add 0.1 million b/d of production in 2019.
Brazil's petroleum and other liquid fuels production is expected to grow by 0.1 million b/d in 2018 and by 0.2 million b/d in 2019, accounting for the third-highest source of non-OPEC production growth after the United States and Canada. Development of pre-salt resources and recent regulatory changes in the Brazilian oil industry are the main drivers of the growth. Continued implementation of reforms, including those to local content rules, could result in higher production growth during the forecast period. The oil-rich Santos Basin, particularly the Lula field, is expected to add enough oil production in the next two years to offset declines in Brazil's more mature onshore and offshore areas. Production at Lula began in November 2017.
Other sources of growth for non-OPEC petroleum and other liquid fuels production in 2018 and 2019 include Kazakhstan, where EIA forecasts production to continue to increase at the Kashagan field.
Norway is expected to post a production increase of 0.1 million b/d in 2018 before production decreases modestly in 2019, as steep crude oil production decline rates offset the expected startup of the Martin Linge and Johan Sverdrup fields, along with a number of smaller fields.
Russia's petroleum and other liquid fuels production is expected to fall by about 0.1 million b/d in 2018 and remain at that level in 2019. Russia's output is expected to decrease from a number of oil fields, which will be partly offset by increases in new field production, including the Erginskoye field in Western Siberia. Erginskoye is expected to begin production in 2019 and to reach peak production of 0.1 million b/d beyond the end of the current forecast period.
Non-OPEC unplanned supply outages in December 2017 were 0.6 million b/d, an increase of 0.3 million b/d compared with the November level. The increase mainly reflected a 0.3 million b/d disruption in the United Kingdom, where the Forties pipeline was shut on December 11. The pipeline closure required fields that rely on the Forties pipeline for takeaway transportation to shut in production. The fields included the Buzzard, United Kingdom's largest oilfield. Ineos, the pipeline's operator, reportedly restarted flows at a reduced rate in late December.
During 2017, non-OPEC unplanned supply outages averaged about 0.5 million b/d, roughly 0.1 million b/d higher than the 2016 average. The increase mainly reflected outages in Canada at the Syncrude Mildred Lake facility during the spring and summer of 2017, along with production shut-ins in the U.S. Gulf of Mexico as a result of hurricanes.
OPEC Petroleum and Other Liquid Fuels Supply. OPEC crude oil production averaged 32.5 million b/d in 2017, a decrease of 0.2 million b/d from 2016. The decline was mainly a result of the November 2016 OPEC production agreement that aimed to limit OPEC crude oil output to 32.5 million b/d. Saudi Arabia and a number of Persian Gulf producers reduced crude oil production in support of the agreement. Other countries saw supplies decline because of political factors, as was the case in Venezuela. OPEC and non-OPEC participants agreed on November 30, 2017, to extend the production cuts through the end of 2018 in an effort to reduce global oil inventories. OPEC crude oil production is forecast to increase by 0.2 million b/d in 2018, partially reflecting EIA's expectation of Libya maintaining relatively high production levels achieved near the end of 2017. EIA expects that OPEC crude oil output will rise by an additional 0.3 million b/d in 2019 as crude oil production slowly returns to pre-agreement levels.
In the fourth quarter of 2017, the average compliance rate among OPEC members was near 100%. However, the high compliance rate in the latest data includes a sizeable drop in Venezuela's production level of more than 0.2 million b/d in 2017. As of December 2017, Venezuela's crude oil production was about 1.8 million b/d, the lowest level since February 2003, when most of Venezuela's oil production was shut in during an oil workers' strike. At the time, political opposition to then-president Hugo Chavez organized the industrial action to force a new presidential election, resulting in the shuttering of all but 0.6 million b/d of crude oil production.
EIA expects Venezuela's production to continue to fall through the forecast period as the financial situation of the state-owned Petróleos de Venezuela (PdVSA) becomes more precarious. According to trade press reporting and tanker tracking data, importing diluent for blending with its heavy oil is becoming increasingly difficult for Venezuela. Financial sanctions are also making it difficult to conduct financial transactions, with a number of banks refusing dealings with PdVSA. As a result, Venezuela's oil exports have decreased significantly over the past six months, further limiting Venezuela's access to much-needed cash.
OPEC noncrude oil liquids production averaged 6.8 million b/d in 2017 and is forecast to increase by 0.1 million b/d in 2018 and by 0.2 million b/d in 2019, led by increases in Iran and Qatar.
OPEC unplanned crude oil supply disruptions averaged 1.1 million b/d in December 2017, slightly less than during November. The decline in outages partly reflected increased production in Nigeria. Nigeria's production has also recovered somewhat in 2017 from frequent attacks targeting the oil infrastructure, and the country's December output was 1.8 million b/d, the highest crude oil production level since February 2016. Libya's outages increased in December, as a result of outages at the Waha and AGOCO operated fields during the month, including the late December sabotage of the pipeline that transports Waha field crude oil to the Es Sider terminal. Overall, Libya's restoration of production has reached almost 1.0 million b/d in crude oil output. However, the recent disruptions may signal a possible risk that production in the coming months could be lower than currently expected.
OPEC surplus crude oil production capacity, which averaged 2.1 million b/d in 2017, is expected to fall to 1.8 million b/d in 2018 and to 1.3 million b/d in 2019. Surplus capacity is typically an indicator of market conditions, and surplus capacity lower than 2.5 million b/d indicates a relatively tight oil market. However, ample global oil inventories make the forecast of low surplus capacity less significant.

OECD Petroleum Inventories. EIA estimates that OECD commercial crude oil and other liquid fuels inventories were 2.91 billion barrels at the end of 2017, equivalent to roughly 62 days of consumption. OECD inventories are forecast to rise to 2.96 billion barrels at the end of 2018 and then to 3.05 billion barrels at the end of 2019.

-----
Earlier:

2018, January, 5, 23:55:00
OIL PRICES: ABOVE $67REUTERS - U.S. West Texas Intermediate (WTI) crude futures CLc1 were at $61.81 a barrel at 0750 GMT. That was 20 cents, or 0.3 percent, below their last close. WTI hit a $62.21 the previous day, which was its strongest since May, 2015. Brent crude futures LCOc1 were at $67.88 a barrel, 19 cents, or 0.3 percent, below their last settlement. Brent hit $68.27 the day before, also the highest since May, 2015.
|

2018, January, 3, 16:00:00
GAS PRICES UP TO $2.990/MMBTUPLATTS - NYMEX February natural gas futures extended gains overnight in the US leading up to Tuesday's open, on the back of current and midrange weather support. At 7:20 am ET (1220 GMT) the contract was gripping the upside at $2.990/MMBtu, up 3.7 cents on the session.
|

2017, December, 25, 20:45:00
OIL PRICES - 2018: VOLATILEThe price of oil in 2018 will be volatile with commodity market traders selling on signals of OPEC-Russia “cheating” or members producing more oil than the extended Algiers Agreement output quotas.
|

2017, December, 18, 12:45:00
ЦЕНА URALS: $62,53932МИНФИН РОССИИ - Средняя цена на нефть Urals за период мониторинга с 15 ноября по 14 декабря 2017 года составила $62,53932 за баррель, или $456,5 за тонну.
|

2017, December, 18, 12:35:00
INEVITABLE OIL CHANGESOPEC - Sustainable oil market stability is crucial to attract the level of investment necessary for future demand growth; In the longer term, oil will remain a vital and integral part of the energy mix; Global energy and oil demand will grow in the long term;
|

2017, December, 15, 13:15:00
AFRICA NEEDS GOOD PRICEBLOOMBERG - The region’s median government debt level will probably exceed 50 percent of gross domestic product this year from 34 percent in 2013, while the cost of servicing the liabilities will average almost 10 percent compared with half that four years ago, the International Monetary Fund said.
|

2017, December, 15, 13:10:00
UNCERTAIN OIL PRICESEIA - The forecast for oil prices remains highly uncertain. WTI futures contracts for March 2018 delivery, traded during the five-day period ending December 7, 2017, averaged $57/b. |


