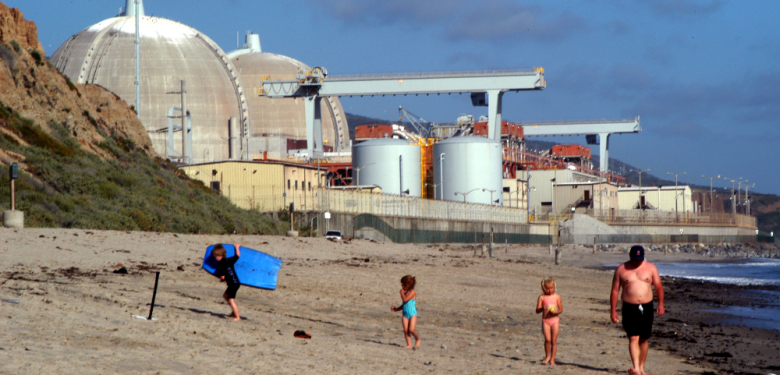
U.S. NUCLEAR POWER - 2017

WNA - Nuclear Power in the USA
- The USA is the world's largest producer of nuclear power, accounting for more than 30% of worldwide nuclear generation of electricity.
- The country's 99 nuclear reactors produced 805 billion kWh in 2016, almost 20% of total electrical output. There are two reactors under construction.
- Following a 30-year period in which few new reactors were built, it is expected that two more new units will come online soon after 2020, these resulting from 16 licence applications made since mid-2007 to build 24 new nuclear reactors.
- Government policy changes since the late 1990s have helped pave the way for significant growth in nuclear capacity.
- Some states have liberalized wholesale electricity markets, which makes the financing of capital-intensive power projects difficult, and coupled with lower gas prices since 2009, have put the economic viability of some existing reactors and proposed projects in doubt.
- The first zero-emission credit programs have commenced, in New York and Illinois.
In 2016, the US electricity generation was 4079 TWh (billion kWh) net, 1380 TWh (34%) of it from gas, 1240 TWh (30%) from coal-fired plant, 805 TWh (19.7%) nuclear, 266 TWh from hydro, 226 TWh from wind, and 117 TWh from other renewables (EIA data). Annual electricity demand is projected to increase to 5,000 billion kWh in 2030, though in the short term it is depressed and has not exceeded the 2007 level. Annual per capita electricity consumption in 2013 was 11,955 kWh. Total net summer capacity is 1060 GWe, less than one-tenth of which is nuclear.
Nuclear power plays a major role. The USA has 99 nuclear power reactors in 30 states, operated by 30 different power companies, and in 2016 they produced 805 TWh. Since 2001 these plants have achieved an average capacity factor of over 90%, generating up to 807 TWh per year and accounting for about 20% of total electricity generated. The average capacity factor has risen from 50% in the early 1970s, to 70% in 1991, and it passed 90% in 2002, remaining at around this level since. In 2016 it was a record 92.5%, compared with wind 34.7% (EIA data). The industry invests about $7.5 billion per year in maintenance and upgrades of the plants.
Average nuclear generation costs have come down from $40/MWh in 2012 to $34/MWh in 2016.
-----
Earlier:

2018, January, 19, 12:30:00
U.S. FOSSIL FUELS WILL UPEIA - EIA forecasts that total fossil fuels production in the United States will average almost 73 quadrillion British thermal units (Btu) in 2018, the highest level of production on record. EIA expects total fossil fuel production to then set another record in 2019, with production forecast to rise to 75 quadrillion Btu.
|

2018, January, 8, 19:25:00
U.S. - IRAN SANCTIONSU.S.DT - "These sanctions target key entities involved in Iran's ballistic missile program, which the Iranian regime prioritizes over the economic well-being of the Iranian people. As the Iranian people suffer, their government and the IRGC fund foreign militants, terrorist groups, and human rights abuses," said Treasury Secretary Steven T. Mnuchin. "The United States will continue to decisively counter the Iranian regime's malign activity, including additional sanctions targeting human rights abuses. We will not hesitate to call out the regime's economic mismanagement, and diversion of significant resources to fund threatening missile systems at the expense of its citizenry."
|

2017, December, 20, 19:30:00
U.S. PETROLEUM DELIVERIES UP TO 19.9 MBDAPI - Total petroleum deliveries in November rose to 19.9 million barrels per day. This was the strongest November monthly demand since 2007. Cumulatively through the first 11 months of the 2017, total domestic petroleum deliveries rose by 0.9 percent, which exceeded demand growth in 2016 despite higher prices. |

2017, December, 15, 12:55:00
NUCLEAR - 2050: 25%WNN - According to the Foratom statement, World Nuclear Association Director General Agneta Rising said: "By 2050, nuclear energy must account for 25% of energy generation if we are to meet our climate targets. With nuclear making up 11% of generation in 2014, an extra 1000 GWe in nuclear capacity will need to be built by 2050. However, meeting this goal will not be easy."
|

2017, November, 9, 13:50:00
EIA: NUCLEAR ENERGY WILL UPEIA projects that global nuclear capacity will grow at an average annual rate of 1.6% from 2016 through 2040, led predominantly by countries outside of the Organization for Economic Cooperation and Development (OECD). EIA expects China to continue leading world nuclear growth, followed by India. This growth is expected to offset declines in nuclear capacity in the United States, Japan, and countries in Europe.
|

2017, October, 14, 18:38:00
U.S. NUCLEAR POWER HELPSREUTERS - “If we lose our supply chain, if we lose our intellectual chain of supply of bright scientists because we basically pushed the nuclear industry back, then we’re going to lose our role as a leader when it comes to nuclear energy in the world,” Perry said. |

2017, February, 28, 18:50:00
BP ENERGY OUTLOOK 2035The growing world economy will require more energy, but consumption is expected to grow less quickly than in the past - at 1.3% per year over the Outlook period (2015-2035) compared with 2.2% per year in 1995-2015. |


