2018-10-04 14:40:00
U.S. OIL INVENTORIES DOWN
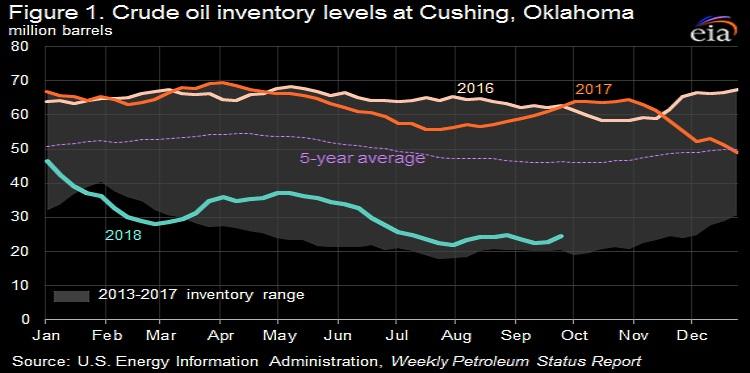
U.S. EIA - U.S. crude oil inventories at Cushing, Oklahoma, fell by more than half in the past year
Crude oil inventories held at Cushing, Oklahoma, decreased by more than half since this time last year, recently falling to lows last reached in 2014. Logistical factors and strong demand for crude oil from both domestic refining and exports markets have contributed to the steep year-over-year decrease. Because inventories can satisfy either current or future demand, their levels are also sensitive to the relationship between the current price of oil and the expectations of future prices. Since October 2017, the forward curve of West Texas Intermediate (WTI) futures prices has been in backwardation, where near-term deliveries are priced higher than long-term deliveries.
As of September 28, 2018, crude oil inventories at Cushing were 24.5 million barrels, which is 22.1 million barrels lower than at the start of the year and 21.8 million barrels lower than the hub's five-year (2013–17) average for this time of year (Figure 1). The relatively low level of crude oil inventories at Cushing does not indicate scarcity of crude oil in the United States. Total U.S. commercial inventories and Midwest (Petroleum Administrative District for Defense, or PADD, 2) inventories, excluding Cushing, have not decreased at nearly the same rate as inventories at Cushing. Total U.S. inventories are 87,000 barrels lower than their five-year average of 404.1 million barrels.
Crude oil storage capacity at Cushing increased from 57.8 million barrels of net available shell storage capacity in March 2011 to 92.1 million barrels in March 2018 (the latest data available). Cushing accounts for approximately half of all commercial crude oil storage capacity in the Midwest and about 16% of all commercial crude oil storage in the United States.
The level of inventories held at Cushing is a closely watched market indicator, because Cushing is the market hub for West Texas Intermediate (WTI) crude oil and is the physical delivery point for crude oil futures contracts traded on the New York Mercantile Exchange. If market expectations indicate a change toward relatively stronger future demand or lower future supply, prices for futures contracts will tend to increase, encouraging inventory builds to satisfy the otherwise tightening future balance. However, a sharp loss of current production or an unexpected increase in current consumption tends to push up spot prices relative to futures prices and encourage inventory drawdowns to meet the current demand.
Amid generally falling crude oil inventories since mid-2017 and a global increase in near-term supply uncertainty, the structure of crude oil futures prices has moved out of contango—where near-term futures contracts are lower than longer-dated ones—of 2015–17 and into backwardation. The shift into backwardation has historically prompted many market participants to sell rather than store crude oil (Figure 2).

In response to robust domestic and international demand for motor gasoline and distillate fuel oil, U.S. refineries have recently been running at record levels. Refinery operations in the Gulf Coast (PADD 3) and the Midwest—the regions with most refinery capacity in the country—are largely driving the higher input levels. High refinery runs in PADD 2 and PADD 3 can lower Cushing inventories because the major refining centers in both regions are closely connected to Cushing via large pipelines.
The Gulf Coast, which has more than half of all U.S. refinery capacity, reached a new record input level with four-week average gross refinery inputs of 9.6 million barrels per day (b/d) for the week ending August 31. The Midwest has the second-highest refinery capacity and the four-week average gross refinery inputs reached a record-high 4.1 million b/d for the week ending August 24.
High refinery runs in PADD 2 and PADD 3 can draw barrels directly from Cushing and divert barrels that might have otherwise gone to Cushing for storage. Movements of crude oil from Western Canada fit both scenarios. The volumes of Canadian oil processed in the Midwest reached a record high in June 2018, diverting barrels that might have gone on to Cushing. The volumes of Canadian oil processed in the Gulf Coast also increased in 2018, reaching a new record high in April, likely drawing oil from Cushing (Figure 3).

In addition to strong demand for crude oil by refineries, U.S. crude oil exports have risen steeply year over year. U.S. crude oil exports increased by 787,000 b/d, or more than 80%, from the first half of 2017 to the first half of 2018 and set a new monthly record of 2.2 million b/d in June.
Pipelines built to transport crude oil from centers of high production growth, such as the Permian and Bakken regions, have largely bypassed Cushing. New pipelines completed since 2015 have provided routes that transport oil directly to refining centers. These pipelines include the Dakota Access Pipeline from the Bakken fields in North Dakota to Patoka, Illinois, and the Energy Transfer Crude Oil Pipeline (ETCO) from Patoka to Nederland, Texas.
In the Permian Basin, which accounted for approximately half of all U.S. oil production in September 2018, severe constraints in pipeline takeaway capacity have limited the volume of crude oil that could go to Cushing. With the WTI crude oil futures market in backwardation, producers in the Permian have an incentive to sell their oil rather than send it to Cushing for storage.
Propane/propylene inventories rise
U.S. propane/propylene stocks increased by 2.4 million barrels last week to 78.7 million barrels as of September 28, 2018, 6.6 million barrels (7.7%) lower than the five-year (2013-2017) average inventory level for this same time of year. Gulf Coast and Midwest inventories increased by 1.7 million barrels and 1.1 million barrels, respectively, while East Coast and Rocky Mountain/West Coast inventories decreased by 0.3 million barrels and 0.1 million barrels, respectively. Propylene non-fuel-use inventories represented 2.7% of total propane/propylene inventories.
-----
Earlier:

2018, October, 1, 11:35:00
U.S. JULY OIL PRODUCTION 10.964 MBDU.S. EIA - US oil production average 10.964 million b/d in July. Production in July was up 1.73 million b/d from July 2017. U.S. natural gas production average 100,243 million cubic feet per day. Production in July was up 11,093 mcfd from July 2017.
|

2018, October, 1, 10:50:00
U.S. RIGS UP 1 TO 1,054BAKER HUGHES A GE - U.S. Rig Count is up 1 rig from last week to 1,054, with oil rigs down 3 to 863, gas rigs up 3 to 189, and miscellaneous rigs up 1 to 2. Canada Rig Count is down 19 rigs from last week to 178, with oil rigs down 13 to 122 and gas rigs down 6 to 56.
|

2018, September, 26, 09:25:00
U.S. OIL EXPORT RECORDU.S. EIA - Crude oil surpassed hydrocarbon gas liquids (HGL) to become the largest U.S. petroleum export, with 1.8 million barrels per day (b/d) of exports in the first half of 2018. U.S. crude oil exports increased by 787,000 b/d, or almost 80%, from the first half of 2017 to the first half of 2018 and set a new monthly record of 2.2 million b/d in June. |

2018, September, 21, 10:30:00
U.S. CAPITAL EXPENDITURES UPU.S. EIA - Second-quarter 2018 financial results for 45 U.S. oil exploration and production companies that the U.S. Energy Information Administration (EIA) regularly tracks reveal that most companies increased their capital expenditure budgets for 2018 compared with initial budgets made at the beginning of the year. |

2018, September, 21, 10:25:00
U.S. ENERGY CASH: $119 BLNU.S. EIA - Energy companies’ free cash flow—the difference between cash from operations and capital expenditure—was $119 billion for the four quarters ending June 30, 2018, the largest four-quarter sum during 2013–18 Companies reduced debt for seven consecutive quarters, contributing to the lowest long-term debt-to-equity ratio since third-quarter 2014 |

2018, September, 19, 13:35:00
U.S. PRODUCTION: OIL + 79 TBD, GAS + 961 MCFDU.S. EIA - Crude oil production from the major US onshore regions is forecast to increase 79,000 b/d month-over-month in October from 7,515 to 7,594 thousand barrels/day , gas production to increase 961 million cubic feet/day from 72,127 to 73,088 million cubic feet/day . |

2018, September, 7, 12:45:00
U.S. PETROLEUM EXPORT RECORDU.S. EIA - The United States exported 7.3 million barrels per day (b/d) of crude oil and petroleum products in the first half of 2018, when exports of crude oil and hydrocarbon gas liquids (HGL) set record monthly highs. Crude oil surpassed HGLs to become the largest U.S. petroleum export, with 1.8 million b/d of exports in the first half of 2018. U.S. exports of crude oil, HGLs, and motor gasoline grew in the first half of 2018 compared with the same period in 2017, while distillate exports decreased 84,000 b/d |


