2018-10-15 12:00:00
U.S. RIGS UP 11 TO 1,063
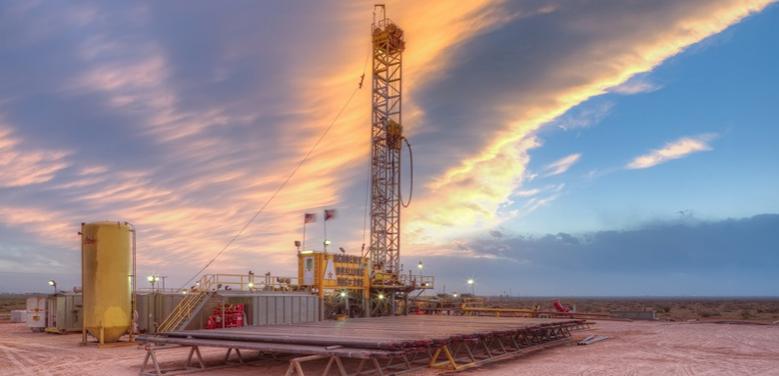
BHGE - U.S. Rig Count is up 11 rigs from last week to 1,063, with oil rigs up 8 to 869, gas rigs up 4 to 193, and miscellaneous rigs down 1 to 1.
U.S. Rig Count is up 135 rigs from last year's count of 928, with oil rigs up 126, gas rigs up 8, and miscellaneous rigs up 1.
The U.S. Offshore Rig Count is unchanged at 23 rigs and up 3 rigs year-over-year.
Canada Rig Count is up 13 rigs from last week to 195, with oil rigs up 8 to 127 and gas rigs up 5 to 68.
Canada Rig Count is down 17 rigs from last year's count of 212, with oil rigs up 15 and gas rigs down 32.
| Rotary Rig Count | |||||||||
| 10/12/18 | |||||||||
| Week | Year | ||||||||
| Location | Week | +/- | Ago | +/- | Ago | ||||
| Land | 1037 | 11 | 1026 | 130 | 907 | ||||
| Inland Waters | 3 | 0 | 3 | 2 | 1 | ||||
| Offshore | 23 | 0 | 23 | 3 | 20 | ||||
| United States Total | 1063 | 11 | 1052 | 135 | 928 | ||||
| Gulf Of Mexico | 22 | 0 | 22 | 2 | 20 | ||||
| Canada | 195 | 13 | 182 | -17 | 212 | ||||
| North America | 1258 | 24 | 1234 | 118 | 1140 | ||||
| U.S. Breakout Information | This Week | +/- | Last Week | +/- | Year Ago | ||||
| Oil | 869 | 8 | 861 | 126 | 743 | ||||
| Gas | 193 | 4 | 189 | 8 | 185 | ||||
| Miscellaneous | 1 | -1 | 2 | 1 | 0 | ||||
| Directional | 70 | 4 | 66 | -9 | 79 | ||||
| Horizontal | 927 | 8 | 919 | 141 | 786 | ||||
| Vertical | 66 | -1 | 67 | 3 | 63 | ||||
| Canada Breakout Information | This Week | +/- | Last Week | +/- | Year Ago | ||||
| Oil | 127 | 8 | 119 | 15 | 112 | ||||
| Gas | 68 | 5 | 63 | -32 | 100 | ||||
| Major State Variances | This Week | +/- | Last Week | +/- | Year Ago | ||||
| Alaska | 5 | 0 | 5 | -1 | 6 | ||||
| California | 13 | 0 | 13 | -1 | 14 | ||||
| Colorado | 33 | 1 | 32 | -1 | 34 | ||||
| Kansas | 1 | 0 | 1 | 0 | 1 | ||||
| Louisiana | 64 | 2 | 62 | -1 | 65 | ||||
| New Mexico | 102 | 3 | 99 | 33 | 69 | ||||
| North Dakota | 52 | 0 | 52 | 1 | 51 | ||||
| Ohio | 17 | -1 | 18 | -12 | 29 | ||||
| Oklahoma | 142 | -1 | 143 | 18 | 124 | ||||
| Pennsylvania | 45 | 0 | 45 | 13 | 32 | ||||
| Texas | 532 | 8 | 524 | 88 | 444 | ||||
| Utah | 6 | 0 | 6 | -6 | 12 | ||||
| West Virginia | 13 | 0 | 13 | -2 | 15 | ||||
| Wyoming | 30 | 1 | 29 | 7 | 23 | ||||
| Major Basin Variances | This Week | +/- | Last Week | +/- | Year Ago | ||||
| Ardmore Woodford | 3 | 0 | 3 | 1 | 2 | ||||
| Arkoma Woodford | 8 | 1 | 7 | -3 | 11 | ||||
| Barnett | 2 | 0 | 2 | -2 | 4 | ||||
| Cana Woodford | 64 | -2 | 66 | 4 | 60 | ||||
| DJ-Niobrara | 28 | 1 | 27 | 3 | 25 | ||||
| Eagle Ford | 77 | -1 | 78 | 14 | 63 | ||||
| Granite Wash | 13 | 0 | 13 | 1 | 12 | ||||
| Haynesville | 50 | 0 | 50 | 6 | 44 | ||||
| Marcellus | 56 | 0 | 56 | 11 | 45 | ||||
| Mississippian | 7 | 0 | 7 | 2 | 5 | ||||
| Permian | 489 | 4 | 485 | 105 | 384 | ||||
| Utica | 19 | -1 | 20 | -11 | 30 | ||||
| Williston | 52 | 0 | 52 | 1 | 51 | ||||
-----
Earlier:

2018, October, 8, 10:10:00
U.S. RIGS DOWN 2 TO 1,052BAKER HUGHES A GE - U.S. Rig Count is down 2 rigs from last week to 1,052, with oil rigs down 2 to 861, gas rigs unchanged at 189, and miscellaneous rigs unchanged at 2. Canada Rig Count is up 4 rigs from last week to 182, with oil rigs down 3 to 119 and gas rigs up 7 to 63. |

2018, October, 1, 10:50:00
U.S. RIGS UP 1 TO 1,054BAKER HUGHES A GE - U.S. Rig Count is up 1 rig from last week to 1,054, with oil rigs down 3 to 863, gas rigs up 3 to 189, and miscellaneous rigs up 1 to 2. Canada Rig Count is down 19 rigs from last week to 178, with oil rigs down 13 to 122 and gas rigs down 6 to 56.
|

2018, September, 24, 15:00:00
U.S. RIGS DOWN 2 TO 1,053BAKER HUGHES A GE - U.S. Rig Count is down 2 rigs from last week to 1,053, with oil rigs down 1 to 866, gas rigs unchanged at 186, and miscellaneous rigs down 1 to 1. Canada Rig Count is down 29 rigs from last week to 197, with oil rigs down 13 to 135 and gas rigs down 16 to 62.
|

2018, September, 21, 10:30:00
U.S. CAPITAL EXPENDITURES UPU.S. EIA - Second-quarter 2018 financial results for 45 U.S. oil exploration and production companies that the U.S. Energy Information Administration (EIA) regularly tracks reveal that most companies increased their capital expenditure budgets for 2018 compared with initial budgets made at the beginning of the year.
|

2018, September, 21, 10:25:00
U.S. ENERGY CASH: $119 BLNU.S. EIA - Energy companies’ free cash flow—the difference between cash from operations and capital expenditure—was $119 billion for the four quarters ending June 30, 2018, the largest four-quarter sum during 2013–18 Companies reduced debt for seven consecutive quarters, contributing to the lowest long-term debt-to-equity ratio since third-quarter 2014 |

2018, September, 19, 13:35:00
U.S. PRODUCTION: OIL + 79 TBD, GAS + 961 MCFDU.S. EIA - Crude oil production from the major US onshore regions is forecast to increase 79,000 b/d month-over-month in October from 7,515 to 7,594 thousand barrels/day , gas production to increase 961 million cubic feet/day from 72,127 to 73,088 million cubic feet/day .
|

2018, September, 17, 14:40:00
U.S. RIGS UP 7 TO 1,055BAKER HUGHES A GE - U.S. Rig Count is up 7 rigs from last week to 1,055, with oil rigs up 7 to 867, gas rigs unchanged at 186, and miscellaneous rigs unchanged at 2. Canada Rig Count is up 22 rigs from last week to 226, with oil rigs up 15 to 148 and gas rigs up 7 to 78. |


