2018-11-02 12:05:00
U.S. OIL PRODUCTION 11.3 MBD
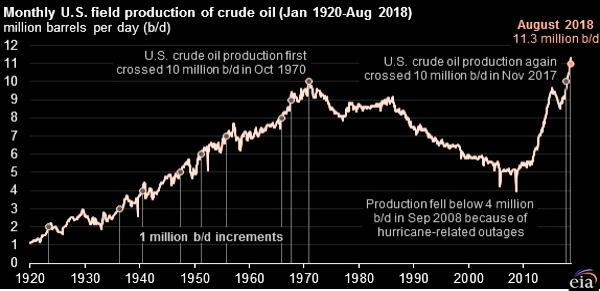
U.S. EIA - U.S. crude oil production reached 11.3 million barrels per day (b/d) in August 2018 up from 10.9 million b/d in July. This is the first time that monthly U.S. production levels surpassed 11 million b/d. U.S. crude oil production exceeded the Russian Ministry of Energy's estimated August production of 11.2 million b/d, making the United States the leading crude oil producer in the world.
Monthly crude oil production reached a record high in several states. Texas had the highest record level at 4.6 million b/d, followed by North Dakota at 1.3 million b/d. Other states that had record-high production levels were New Mexico, Oklahoma, Colorado, and West Virginia. Production in the Federal Offshore Gulf of Mexico also hit a record high of 1.9 million b/d.
The Permian region, which is located in western Texas and eastern New Mexico, accounts for about 63% of total Texas crude oil production and 95% of total New Mexico crude oil production. From January 2018 to August 2018, Texas crude oil production increased by 683,000 b/d (15%) and New Mexico production increased by 182,000 b/d (25%).
The growth in Texas and New Mexico since the start of 2018 surpassed EIA's previous expectations, which assumed that pipeline capacity constraints in the Permian region would dampen production growth in response to the increased differential between the West Texas Intermediate (WTI) crude oil price at Cushing, Oklahoma, and the WTI price at Midland, Texas. In August 2018, this differential had grown to more than $16 per barrel (b), up from $0.43/b in January. However, industry efficiencies in pipeline utilization and increased trucking and rail transport in the region have allowed crude oil production to continue to grow at a higher rate than EIA expected.

From May through August, production in the Gulf of Mexico grew by an average of 130,000 b/d every month, a significant increase from the growth rate in the first four months of the year. This increase was primarily the result of a number of fields returning to full production after several months of maintenance and other infrastructure issues that arose from Hurricanes Harvey and Nate in 2017.
U.S. crude oil production has increased significantly during the past ten years, driven mainly by production from tight oil formations using horizontal drilling and hydraulic fracturing. EIA estimates of crude oil production from tight formations in August 2018 reached 6.2 million b/d, or 55% of the national total.

WTI-Cushing spot prices averaged about $68/b in August, down from the July average of $71/b. EIA forecasts the average spot price for WTI to remain near that level in the fourth quarter of 2018. The higher crude oil prices at the end of 2018 and throughout 2019 will likely support increased U.S. crude oil production. EIA forecasts U.S. crude oil production to increase by 1.0 million b/d in 2019.
-----
Earlier:

2018, October, 22, 12:10:00
U.S. OIL PRODUCTION 11 MBDAPI - The American Petroleum Institute’s latest monthly statistical report shows the U.S. produced a record 11.0 million barrels of crude oil per day (mb/d) in September. U.S. liquid fuels production grew 2.2 mb/d year-over-year (y/y), and the U.S. met virtually all global oil demand growth. As supply increased, crude oil inventories also rose in September but remained nearly 14 percent below those of September 2017. |

2018, October, 17, 09:40:00
U.S. PRODUCTION: OIL + 98 TBD, GAS + 957 MCFDU.S. EIA - Crude oil production from the major US onshore regions is forecast to increase 98,000 b/d month-over-month in November from 7,616 to 7,714 thousand barrels/day , gas production to increase 957 million cubic feet/day from 73,104 to 74,061 million cubic feet/day . |

2018, October, 4, 14:40:00
U.S. OIL INVENTORIES DOWNU.S. EIA - Crude oil inventories held at Cushing, Oklahoma, decreased by more than half since this time last year, recently falling to lows last reached in 2014. Logistical factors and strong demand for crude oil from both domestic refining and exports markets have contributed to the steep year-over-year decrease. |

2018, October, 1, 11:35:00
U.S. JULY OIL PRODUCTION 10.964 MBDU.S. EIA - US oil production average 10.964 million b/d in July. Production in July was up 1.73 million b/d from July 2017. U.S. natural gas production average 100,243 million cubic feet per day. Production in July was up 11,093 mcfd from July 2017. |

2018, September, 26, 09:25:00
U.S. OIL EXPORT RECORDU.S. EIA - Crude oil surpassed hydrocarbon gas liquids (HGL) to become the largest U.S. petroleum export, with 1.8 million barrels per day (b/d) of exports in the first half of 2018. U.S. crude oil exports increased by 787,000 b/d, or almost 80%, from the first half of 2017 to the first half of 2018 and set a new monthly record of 2.2 million b/d in June. |

2018, September, 24, 15:15:00
THE TRADE WAR LIMITING U.S.API - “Placing constraints on exports of American-made energy works against America’s energy future,” said API Chief Economist Dean Foreman. “While the picture is still a bit muddied, it seems to be getting clearer – the trade war appears to be limiting the United States’ access to crude export markets. As we produce more energy here at home, the U.S. needs markets for its products in order for our economy to continue to grow. There’s no question that the 1.6 MBD increase U.S. petroleum net imports, which undid a full year’s worth progress, is a setback to the United States’ goal of energy dominance.” |

2018, September, 21, 10:25:00
U.S. ENERGY CASH: $119 BLNU.S. EIA - Energy companies’ free cash flow—the difference between cash from operations and capital expenditure—was $119 billion for the four quarters ending June 30, 2018, the largest four-quarter sum during 2013–18 Companies reduced debt for seven consecutive quarters, contributing to the lowest long-term debt-to-equity ratio since third-quarter 2014 |


