2018-11-19 11:30:00
U.S. PETROLEUM DEMAND 20.8 MBD
U.S. API - U.S. petroleum demand in October of 20.8 million barrels per day (mb/d) was the strongest for the month since 2006 and a continued reflection of solid economic activity. New U.S. records for the month of October included:
- Demand for gasoline (9.5 mb/d);
- Refining and petrochemical demand for liquid feedstocks, naphtha, and gasoil (“other oils”, 5.1 mb/d); and,
- Refinery throughput (16.6 mb/d).
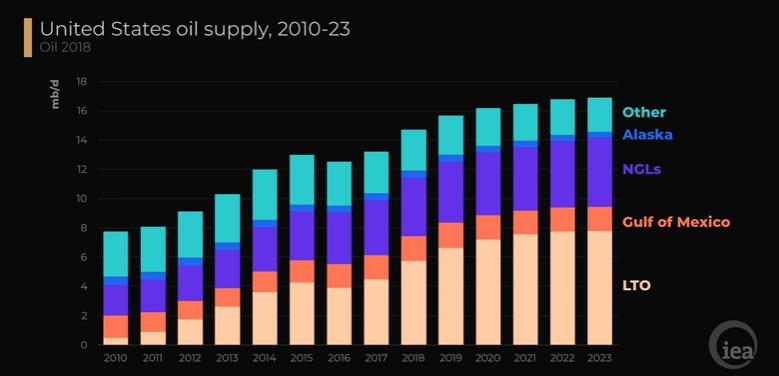
The United States also produced 11.2 mb/d of crude oil and another 4.5 mb/d of natural gas liquids (NGLs) in October, continuing to meet virtually all global oil demand growth so far in 2018. The Energy Information Administration (EIA) separately revised its short-term outlook to project a global oil supply surplus and lower prices for this quarter through 2019. With EIA final data for August (11.3 mb/d for crude oil and 4.6 mb/d for NGLs), the October U.S. production levels were not records but nonetheless reflected strong investment, drilling activity, and output. As supply growth outpaced that of refinery throughput and exports, U.S. crude oil inventories rose 6.3 percent between September and October; this was the biggest monthly accumulation since March 2015.
In October, U.S. petroleum exports (7.6 mb/d) increased for a second consecutive month since a setback in August, when China stopped purchasing U.S. crude oil. However, with U.S. oil prices having remained more than $9.00 per barrel below international levels, the European Union, Japan, Mexico, and Canada in total increased their purchases of U.S. crude oil and refined products by more than $1.0 billion between August and September.
More information is here.
-----
Earlier:

2018, November, 16, 09:10:00
U.S. OIL INVENTORIES UPU.S. EIA - U.S. commercial crude oil inventories (excluding those in the Strategic Petroleum Reserve) increased by 10.3 million barrels from the previous week.
|

2018, November, 15, 15:47:00
OPEC: OIL DEMAND 2019: 100 MBDOPEC - In 2018, oil demand growth is anticipated to increase by 1.50 mb/d y-o-y, a downward revision from the previous month of 40 tb/d, mainly due to weaker-than-expected oil demand data from the Middle East and, to a lesser extent, China during 3Q18. Expected total oil demand for the year is anticipated to reach 98.79 mb/d. In 2019, world oil demand growth is forecast to grow by 1.29 mb/d y-o-y, about 70 tb/d lower than last month’s projection, with total world consumption to reach 100.08 mb/d.
|

2018, November, 14, 12:00:00
U.S. PRODUCTION: OIL + 113 TBD, GAS + 1,038 MCFDU.S. EIA - Crude oil production from the major US onshore regions is forecast to increase 113,000 b/d month-over-month in December from 7,831 to 7,944 thousand barrels/day , gas production to increase 1,038 million cubic feet/day from 74,041 to 75,079 million cubic feet/day
|

2018, November, 2, 12:05:00
U.S. OIL PRODUCTION 11.3 MBDU.S. EIA - U.S. crude oil production reached 11.3 million barrels per day (b/d) in August 2018,
|

2018, October, 22, 12:10:00
U.S. OIL PRODUCTION 11 MBDAPI - The American Petroleum Institute’s latest monthly statistical report shows the U.S. produced a record 11.0 million barrels of crude oil per day (mb/d) in September. U.S. liquid fuels production grew 2.2 mb/d year-over-year (y/y), and the U.S. met virtually all global oil demand growth. As supply increased, crude oil inventories also rose in September but remained nearly 14 percent below those of September 2017.
|

2018, October, 17, 09:40:00
U.S. PRODUCTION: OIL + 98 TBD, GAS + 957 MCFDU.S. EIA - Crude oil production from the major US onshore regions is forecast to increase 98,000 b/d month-over-month in November from 7,616 to 7,714 thousand barrels/day , gas production to increase 957 million cubic feet/day from 73,104 to 74,061 million cubic feet/day .
|

2018, October, 4, 14:40:00
U.S. OIL INVENTORIES DOWNU.S. EIA - Crude oil inventories held at Cushing, Oklahoma, decreased by more than half since this time last year, recently falling to lows last reached in 2014. Logistical factors and strong demand for crude oil from both domestic refining and exports markets have contributed to the steep year-over-year decrease. |


