2018-12-12 09:00:00
OIL PRICE 2019: $61
U.S. EIA - SHORT-TERM ENERGY OUTLOOK
Forecast Highlights
Global liquid fuels
- Brent crude oil spot prices averaged $65 per barrel (b) in November, down $16/b from October, the largest monthly average price decline since December 2014.
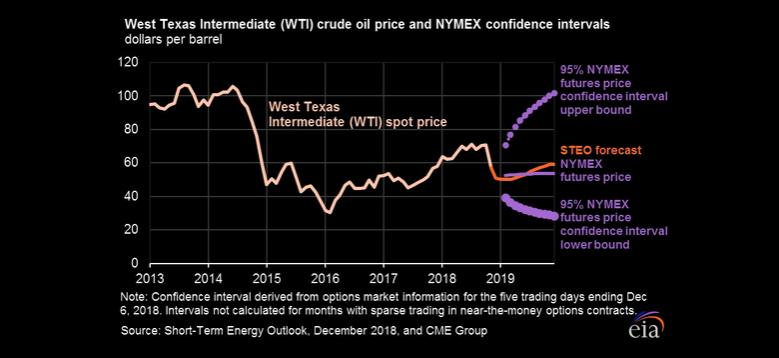
- EIA expects Brent spot prices will average $61 in 2019 and that West Texas Intermediate (WTI) crude oil prices will average about $7/b lower than Brent prices next year. NYMEX WTI futures and options contract values for March 2019 delivery that traded during the five-day period ending December 6, 2018, suggest a range of $36/b to $77/b encompasses the market expectation for March WTI prices at the 95% confidence level.
- EIA estimates that U.S. crude oil production averaged 11.5 million barrels per day (b/d) in November, up 150,000 b/d from October levels because of platforms resuming normal operations after hurricane-related outages in October. EIA expects that U.S. crude oil production will average 10.9 million b/d in 2018, up from 9.4 million b/d in 2017, and will average 12.1 million b/d in 2019.
- EIA forecasts total global liquid fuels inventories will increase by about 0.3 million b/d in 2018 and by 0.2 million b/d in 2019. Global liquid fuels production is forecast to increase by 1.4 million b/d in 2019. EIA expects production growth in the United States to be partially offset by declining production elsewhere, notably in the Organization of the Petroleum Exporting Countries (OPEC), where EIA forecasts that liquid fuels production will decline by 0.9 million b/d in 2019. EIA expects global liquid fuels consumption to increase by 1.5 million b/d in 2019, with growth largely coming from China, the United States, and India.

Natural Gas
- The Henry Hub natural gas spot price averaged $4.15/million British thermal units (MMBtu) in November, up $0.87/MMBtu from the October average. Cold temperatures and low inventory levels contributed to the increase in price. Despite low inventory levels, EIA expects strong growth in U.S. natural gas production to put downward pressure on prices in 2019. EIA expects Henry Hub natural gas spot prices to average $3.11/MMBtu in 2019, down 6 cents from the 2018 average and down from a forecast average price of $3.88/MMBtu in the fourth quarter of 2018. NYMEX futures and options contract values for March 2019 delivery traded during the five-day period ending December 6, 2018, suggest a range of $1.85/MMBtu to $8.37/MMBtu encompasses the market expectation for March Henry Hub natural gas prices at the 95% confidence level.

- EIA estimates that U.S. natural gas storage inventories were 3.0 trillion cubic feet (Tcf) at the end of November, which was 19% lower than the five-year (2013–17) average for the end of November.
- EIA forecasts that dry natural gas production will average 83.3 billion cubic feet per day (Bcf/d) in 2018, up 8.5 Bcf/d from 2017. Both the level and volume growth of natural gas production in 2018 would establish new records. EIA expects natural gas production will continue to rise in 2019 to an average of 90.0 Bcf/d.

Electricity, coal, renewables, and emissions
- EIA expects the share of U.S. total utility-scale electricity generation from natural gas-fired power plants to rise from 32% in 2017 to 35% in 2018 and in 2019. EIA forecasts that the electricity generation share from coal will average 28% in 2018 and 26% in 2019, down from 30% in 2017. The nuclear share of generation was 20% in 2017 and EIA forecasts that it will average about 19% in 2018 and in 2019. Wind, solar, and other nonhydropower renewables provided about 10% of electricity generation in 2017. EIA expects them to provide 10% in 2018 and 11% in 2019. The generation share of hydropower was 7% in 2017, and EIA forecasts that it will be about the same in 2018 and in 2019.
- EIA expects average U.S. solar generation will rise from 212,000 megawatt hours per day (MWh/d) in 2017 to 268,000 MWh/d in 2018 (an increase of 27%) and to 303,000 MWh/d in 2019 (an increase of 13%). In recent years, the industry has seen a shift from fixed-tilt solar PV systems to tracking systems.. Although tracking systems are more expensive than fixed-tilt systems, revenue from the additional electricity generated by following the path of the sun across the sky often exceeds the increased cost.
- U.S. coal exports for the first nine months of 2018 totaled 87 million short tons (MMst), compared with 69 MMst exported during the same period in 2017. In July and September 2018, exports of steam coal (used for generating electricity) exceeded exports of metallurgical coal (used for producing steel). Before July 2018, the last month that this occurred was in February 2015. EIA expects coal exports to total 113 MMst in 2018 and 102 MMst in 2019. EIA expects U.S. coal production will total 762 MMst in 2018 (down 2% from 2017) and 742 MMst in 2019 (down 3% from 2018).
- After declining by 0.8% in 2017, EIA forecasts that U.S. energy-related carbon dioxide (CO2) emissions will rise by 3.0% in 2018. This increase largely reflects more natural gas consumption in 2018 for heating during a colder winter and for electric generation to support more cooling during a warmer summer than in 2017. EIA expects emissions to decline by 1.2% in 2019 because it forecasts that temperatures will return to near normal. Energy-related CO2 emissions are sensitive to changes in weather, economic growth, energy prices, and fuel mix.
More information is here.
-----
Earlier:

2018, December, 3, 11:55:00
U.S. PRODUCTION: OIL +1.1%, GAS +1.8%U.S. EIA - Crude oil production increases 1.1% in September from 11,346 to 11,475 thousand barrels/day , gas production increases 1.8% from 102,659 to 104,461 million cubic feet/day .
|

2018, November, 28, 12:55:00
U.S. ENERGY PRESSUREFT - in the third quarter of this year the US E&P sector was able to cover its capital spending from its operating cash flows, if only barely. The plunge in oil prices over the past two months is bringing those concerns gushing to the surface again.
|

2018, November, 28, 12:40:00
U.S. SUBSTANTIAL DAMAGESPLATTS - Overall, the report found that without more significant global mitigation, "climate change is projected to impose substantial damages on the US economy, human health and the environment."
|

2018, November, 19, 11:30:00
U.S. PETROLEUM DEMAND 20.8 MBDU.S. API - U.S. petroleum demand in October of 20.8 million barrels per day (mb/d) was the strongest for the month since 2006 and a continued reflection of solid economic activity.
|

2018, October, 26, 12:30:00
UPSTREAM NEEDS INVESTMENTOGJ - Spending on worldwide oil and gas developments needs to increase by about 20% to meet future demand growth and ensure companies sustain production over the next decade,
|

2018, October, 12, 11:35:00
OIL PRICES 2018 - 19: $74 - $75U.S. EIA - Brent crude oil spot prices averaged $79 per barrel (b) in September, up $6/b from August. EIA expects Brent spot prices will average $74/b in 2018 and $75/b in 2019. EIA expects West Texas Intermediate (WTI) crude oil prices will average about $6/b lower than Brent prices in 2018 and in 2019.
|

2018, September, 12, 11:35:00
OIL PRICES 2018-19: $73-$74U.S. EIA - EIA expects Brent spot prices will average $73/b in 2018 and $74/b in 2019. EIA expects West Texas Intermediate (WTI) crude oil prices will average about $6/b lower than Brent prices in 2018 and in 2019. NYMEX WTI futures and options contract values for December 2018 delivery that traded during the five-day period ending September 6, 2018, suggest a range of $56/b to $85/b encompasses the market expectation for December WTI prices at the 95% confidence level. |


