2018-12-07 08:00:00


U.S. DEFICIT $55.5 BLN
U.S. BEA - U.S. International Trade in Goods and Services, October 2018
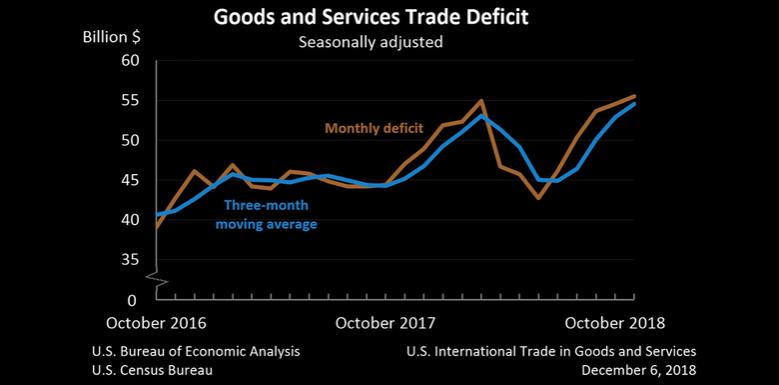
The U.S. Census Bureau and the U.S. Bureau of Economic Analysis announced that the goods and services deficit was $55.5 billion in October, up $0.9 billion from $54.6 billion in September, revised.
| Deficit: | $55.5 Billion | +1.7%° |
| Exports: | $211.0 Billion | -0.1%° |
| Imports: | $266.5 Billion | +0.2%° |
|
Next release: January 8, 2019 (°) Statistical significance is not applicable or not measurable. Data adjusted for seasonality but not price changes Source: U.S. Census Bureau, U.S. Bureau of Economic Analysis; U.S. International Trade in Goods and Services, December 6, 2018. |
||
Exports, Imports, and Balance
October exports were $211.0 billion, $0.3 billion less than September exports. October imports were $266.5 billion, $0.6 billion more than September imports.
The October increase in the goods and services deficit reflected an increase in the goods deficit of $0.9 billion to $78.1 billion and a decrease in the services surplus of $0.1 billion to $22.6 billion.
Year-to-date, the goods and services deficit increased $51.3 billion, or 11.4 percent, from the same period in 2017. Exports increased $149.3 billion or 7.7 percent. Imports increased $200.6 billion or 8.4 percent.
Three-Month Moving Averages
The average goods and services deficit increased $1.7 billion to $54.6 billion for the three months ending in October.
- Average exports increased $0.4 billion to $210.2 billion in October.
- Average imports increased $2.1 billion to $264.8 billion in October.
Year-over-year, the average goods and services deficit increased $9.4 billion from the three months ending in October 2017.
- Average exports increased $12.7 billion from October 2017.
- Average imports increased $22.1 billion from October 2017.
Exports
Exports of goods decreased $0.4 billion to $141.5 billion in October.
Exports of goods on a Census basis decreased $0.4 billion.
- Foods, feeds, and beverages decreased $0.7 billion.
- Soybeans decreased $0.8 billion.
- Capital goods decreased $0.5 billion.Other goods increased $0.5 billion.
- Civilian aircraft engines decreased $0.3 billion.
- Civilian aircraft decreased $0.3 billion.
- Other goods increased $0.5 billion.
- Industrial supplies and materials increased $0.3 billion.
Net balance of payments adjustments increased less than $0.1 billion.
Exports of services increased $0.1 billion to $69.6 billion in October.
- Financial services increased $0.1 billion.
- Other business services, which includes research and development services; professional and management services; and technical, trade-related, and other services, increased $0.1 billion.
- Transport decreased $0.1 billion.
Imports
Imports of goods increased $0.5 billion to $219.6 billion in October.
Imports of goods on a Census basis increased $0.3 billion.
- Consumer goods increased $2.0 billion.Other goods increased $0.8 billion.
- Pharmaceutical preparations increased $1.5 billion.
- Other goods increased $0.8 billion.
- Automotive vehicles, parts, and engines increased $0.7 billion.
- Capital goods decreased $3.2 billion.
- Telecommunications equipment decreased $1.0 billion.
- Computer accessories decreased $0.8 billion.
- Computers decreased $0.7 billion.
Net balance of payments adjustments increased $0.2 billion.
Imports of services increased $0.2 billion to $46.9 billion in October.
- Travel (for all purposes including education) increased $0.2 billion.
Real Goods in 2012 Dollars – Census Basis
The real goods deficit increased $0.6 billion to $87.9 billion in October.
- Real exports of goods decreased $1.2 billion to $149.6 billion.
- Real imports of goods decreased $0.5 billion to $237.5 billion.
Revisions
Exports and imports of goods and services were revised for April through September 2018 to incorporate more comprehensive and updated quarterly and monthly data.
Revisions to September exports
- Exports of goods were revised up less than $0.1 billion.
- Exports of services were revised down $1.2 billion.
Revisions to September imports
- Imports of goods were revised up less than $0.1 billion.
- Imports of services were revised down $0.7 billion.
Goods by Selected Countries and Areas: Monthly – Census Basis
The October figures show surpluses, in billions of dollars, with South and Central America ($3.7), Hong Kong ($2.4), Brazil ($0.7), and Singapore ($0.6). Deficits were recorded, in billions of dollars, with China ($38.2), European Union ($15.1), Mexico ($6.4), Germany ($5.8), Japan ($5.5), Italy ($2.7), OPEC ($2.3), Canada ($2.0), India ($2.0), Saudi Arabia ($1.8), South Korea ($1.8), Taiwan ($1.2), France ($1.1), and United Kingdom (less than $0.1).
- The deficit with the European Union increased $0.9 billion to $15.1 billion in October. Exports decreased $0.9 billion to $26.3 billion and imports decreased less than $0.1 billion to $41.3 billion.
- The deficit with China increased $0.7 billion to $38.2 billion in October. Exports decreased $2.6 billion to $7.6 billion and imports decreased $1.9 billion to $45.7 billion.
- The deficit with Mexico decreased $1.2 billion to $6.4 billion in October. Exports decreased $0.1 billion to $22.4 billion and imports decreased $1.3 billion to $28.8 billion.
Goods and Services by Selected Countries and Areas: Quarterly – Balance of Payments Basis
Statistics on trade in goods and services by country and area are only available quarterly, with a one-month lag. With this release, third-quarter figures are now available.
The third-quarter figures show surpluses, in billions of dollars, with South and Central America ($20.6), Hong Kong ($7.7), Brazil ($7.1), Singapore ($4.2), and United Kingdom ($3.7). Deficits were recorded, in billions of dollars, with China ($95.9), European Union ($30.2), Mexico ($21.6), Germany ($16.3), Japan ($13.4), Italy ($8.8), India ($5.7), France ($3.8), Canada ($2.7), South Korea ($2.2), Taiwan ($2.0), Saudi Arabia ($2.0), and OPEC ($0.9).
- The deficit with China increased $10.3 billion to $95.9 billion in the third quarter. Exports decreased $3.1 billion to $46.0 billion and imports increased $7.2 billion to $141.9 billion.
- The deficit with the European Union increased $6.3 billion to $30.2 billion in the third quarter. Exports decreased $2.0 billion to $143.2 billion and imports increased $4.2 billion to $173.4 billion.
- The deficit with Japan decreased $1.9 billion to $13.4 billion in the third quarter. Exports increased $0.5 billion to $30.4 billion and imports decreased $1.5 billion to $43.7 billion.
-----
Earlier:

2018, November, 30, 11:30:00
U.S. GDP UP OF 3.5%U.S. BEA - Real gross domestic product (GDP) increased at an annual rate of 3.5 percent in the third quarter of 2018, according to the "second" estimate released by the Bureau of Economic Analysis. In the second quarter, real GDP increased 4.2 percent.
|

2018, November, 30, 11:25:00
U.S.: MICH WORSESA - By most accounts, the U.S. has the highest level of economic inequality among developed countries. It has the world's greatest per capita health expenditures yet the lowest life expectancy among comparable countries.
|

2018, November, 28, 12:55:00
U.S. ENERGY PRESSUREFT - in the third quarter of this year the US E&P sector was able to cover its capital spending from its operating cash flows, if only barely. The plunge in oil prices over the past two months is bringing those concerns gushing to the surface again.
|

2018, November, 28, 12:40:00
U.S. SUBSTANTIAL DAMAGESPLATTS - Overall, the report found that without more significant global mitigation, "climate change is projected to impose substantial damages on the US economy, human health and the environment."
|

2018, November, 19, 11:20:00
U.S. SECURITIES OUTFLOW $29.1 BLNU.S. DT - The sum total in September of all net foreign acquisitions of long-term securities, short-term U.S. securities, and banking flows was a net TIC outflow of $29.1 billion. Of this, net foreign private inflows were $23.5 billion, and net foreign official outflows were $52.7 billion.
|

2018, November, 19, 11:15:00
U.S. INDUSTRIAL PRODUCTION UP 0.1%U.S. FRB - Industrial production edged up 0.1 percent in October, as a gain for manufacturing outweighed decreases elsewhere. As a result of upward revisions primarily in mining, the overall index is now reported to have advanced at an annual rate of 4.7 percent in the third quarter, appreciably above the gain of 3.3 percent reported initially.
|

2018, November, 16, 09:20:00
U.S. FINANCIAL RISKSU.S. OFR - The U.S. Office of Financial Research (OFR) released its 2018 Annual Report to Congress, stating that risks to U.S. financial stability remain in the medium range, reflecting a mix of high, moderate, and low risks to the financial system. |


