2018-12-21 14:20:00
U.S. PRODUCTION: OIL + 134 TBD, GAS + 1,127 MCFD
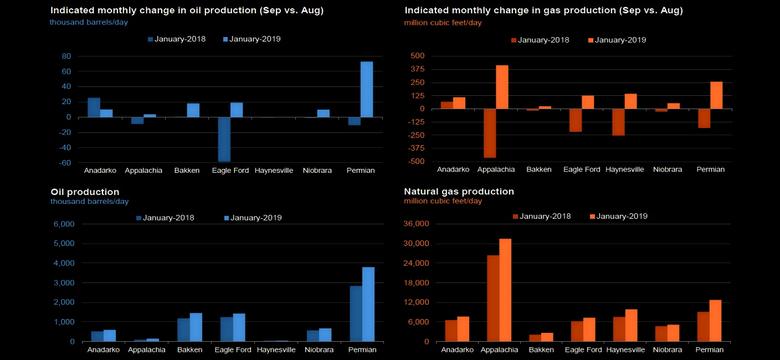
U.S. EIA - Crude oil production from the major US onshore regions is forecast to increase 134,000 b/d month-over-month in January from 8,032 to 8,166 thousand barrels/day , gas production to increase 1,127 million cubic feet/day from 75,789 to 76,916 million cubic feet/day .
| Oil production thousand barrels/day | Gas production million cubic feet/day | |||||
|---|---|---|---|---|---|---|
| Region | December 2018 | January 2019 | change | December 2018 | January 2019 | change |
| Anadarko | 589 | 599 | 10 | 7,535 | 7,644 | 109 |
| Appalachia | 151 | 155 | 4 | 31,037 | 31,451 | 414 |
| Bakken | 1,443 | 1,461 | 18 | 2,657 | 2,682 | 25 |
| Eagle Ford | 1,408 | 1,427 | 19 | 7,206 | 7,331 | 125 |
| Haynesville | 43 | 43 | - | 9,721 | 9,863 | 142 |
| Niobrara | 669 | 679 | 10 | 5,155 | 5,209 | 54 |
| Permian | 3,729 | 3,802 | 73 | 12,478 | 12,736 | 258 |
| Total | 8,032 | 8,166 | 134 | 75,789 | 76,916 | 1,127 |
| New-well oil production per rig barrels/day | New-well gas production per rig thousand cubic feet/day | |||||
|---|---|---|---|---|---|---|
| Region | December 2018 | January 2019 | change | December 2018 | January 2019 | change |
| Anadarko | 413 | 416 | 3 | 2,919 | 2,942 | 23 |
| Appalachia | 147 | 147 | - | 17,244 | 17,446 | 202 |
| Bakken | 1,589 | 1,611 | 22 | 2,048 | 2,095 | 47 |
| Eagle Ford | 1,417 | 1,428 | 11 | 5,940 | 6,038 | 98 |
| Haynesville | 26 | 27 | 1 | 9,012 | 9,152 | 140 |
| Niobrara | 1,227 | 1,237 | 10 | 4,368 | 4,390 | 22 |
| Permian | 616 | 631 | 15 | 1,236 | 1,236 | - |
| Rig-weighted average | 679 | 691 | 12 | 3,850 | 3,881 | 31 |
| Drilled but uncompleted wells (DUC) | |||
| wells | |||
| Region | October 2018 | November 2018 | change |
| Anadarko | 1,090 | 1,135 | 45 |
| Appalachia | 607 | 588 | -19 |
| Bakken | 775 | 767 | -8 |
| Eagle Ford | 1,535 | 1,563 | 28 |
| Haynesville | 201 | 210 | 9 |
| Niobrara | 437 | 421 | -16 |
| Permian | 3,791 | 4,039 | 248 |
| Total | 8,436 | 8,723 | 287 |
More information is here.
-----
Earlier:

2018, December, 17, 10:00:00
U.S. RIGS DOWN 4 TO 1,071BHGE - U.S. Rig Count is down 4 rigs from last week to 1,071, with oil rigs down 4 to 873 and gas rigs unchanged at 198. Canada Rig Count is down 12 rigs from last week to 174, with oil rigs down 7 to 95 and gas rigs down 5 to 79.
|

2018, December, 3, 11:55:00
U.S. PRODUCTION: OIL +1.1%, GAS +1.8%U.S. EIA - Crude oil production increases 1.1% in September from 11,346 to 11,475 thousand barrels/day , gas production increases 1.8% from 102,659 to 104,461 million cubic feet/day .
|

2018, November, 30, 11:40:00
U.S. OIL GAS RESERVES 2017U.S. EIA - Proved reserves of crude oil in the United States increased 19.5% (6.4 billion barrels) to 39.2 billion barrels at Year-End 2017, setting a new U.S. record for crude oil proved reserves. The previous record was 39.0 billion barrels set in 1970. Proved reserves of natural gas increased by 123.2 trillion cubic feet (Tcf) (36.1%) to 464.3 Tcf at year-end 2017—a new U.S. record for total natural gas proved reserves. The previous U.S. record was 388.8 Tcf, set in 2014.
|

2018, November, 28, 12:55:00
U.S. ENERGY PRESSUREFT - in the third quarter of this year the US E&P sector was able to cover its capital spending from its operating cash flows, if only barely. The plunge in oil prices over the past two months is bringing those concerns gushing to the surface again.
|

2018, November, 19, 11:30:00
U.S. PETROLEUM DEMAND 20.8 MBDU.S. API - U.S. petroleum demand in October of 20.8 million barrels per day (mb/d) was the strongest for the month since 2006 and a continued reflection of solid economic activity.
|

2018, November, 16, 09:10:00
U.S. OIL INVENTORIES UPU.S. EIA - U.S. commercial crude oil inventories (excluding those in the Strategic Petroleum Reserve) increased by 10.3 million barrels from the previous week.
|

2018, November, 14, 12:00:00
U.S. PRODUCTION: OIL + 113 TBD, GAS + 1,038 MCFDU.S. EIA - Crude oil production from the major US onshore regions is forecast to increase 113,000 b/d month-over-month in December from 7,831 to 7,944 thousand barrels/day , gas production to increase 1,038 million cubic feet/day from 74,041 to 75,079 million cubic feet/day . |


