2018-03-11 11:20:00
U.S. UNEMPLOYMENT RATE 4.1%
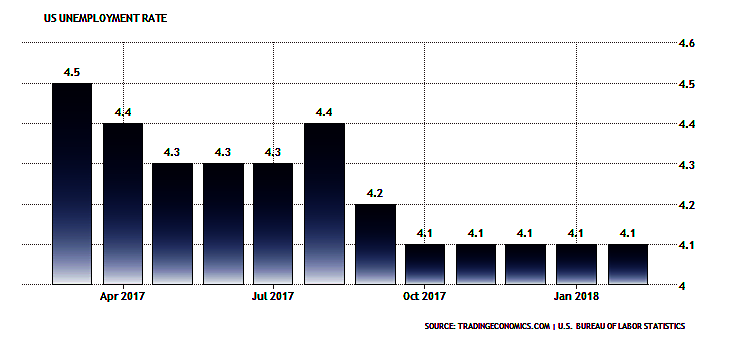
U.S. BLS - Total nonfarm payroll employment increased by 313,000 in February, and the unemployment rate was unchanged at 4.1 percent, the U.S. Bureau of Labor Statistics reported today. Employment rose in construction, retail trade, professional and business services, manufacturing, financial activities, and mining.
In February, the unemployment rate was 4.1 percent for the fifth consecutive month, and the number of unemployed persons was essentially unchanged at 6.7 million.
Table A-1. Employment status of the civilian population by sex and age
| Employment status, sex, and age | Not seasonally adjusted | Seasonally adjusted(1) | |||||||
|---|---|---|---|---|---|---|---|---|---|
| Feb. 2017 |
Jan. 2018 | Feb. 2018 | Feb. 2017 | Oct. 2017 | Nov. 2017 | Dec. 2017 | Jan. 2018 | Feb. 2018 | |
|
TOTAL |
|||||||||
|
Civilian noninstitutional population |
254,246 | 256,780 | 256,934 | 254,246 | 255,766 | 255,949 | 256,109 | 256,780 | 256,934 |
|
Civilian labor force |
159,482 | 160,037 | 161,494 | 159,997 | 160,371 | 160,533 | 160,597 | 161,115 | 161,921 |
|
Participation rate |
62.7 | 62.3 | 62.9 | 62.9 | 62.7 | 62.7 | 62.7 | 62.7 | 63.0 |
|
Employed |
151,594 | 152,848 | 154,403 | 152,511 | 153,846 | 153,917 | 154,021 | 154,430 | 155,215 |
|
Employment-population ratio |
59.6 | 59.5 | 60.1 | 60.0 | 60.2 | 60.1 | 60.1 | 60.1 | 60.4 |
|
Unemployed |
7,887 | 7,189 | 7,091 | 7,486 | 6,524 | 6,616 | 6,576 | 6,684 | 6,706 |
|
Unemployment rate |
4.9 | 4.5 | 4.4 | 4.7 | 4.1 | 4.1 | 4.1 | 4.1 | 4.1 |
|
Not in labor force |
94,764 | 96,743 | 95,439 | 94,248 | 95,395 | 95,416 | 95,512 | 95,665 | 95,012 |
|
Persons who currently want a job |
5,641 | 5,364 | 5,152 | 5,577 | 5,232 | 5,265 | 5,308 | 5,171 | 5,131 |
|
Men, 16 years and over |
|||||||||
|
Civilian noninstitutional population |
122,862 | 124,173 | 124,250 | 122,862 | 123,617 | 123,707 | 123,786 | 124,173 | 124,250 |
|
Civilian labor force |
84,589 | 85,125 | 85,806 | 85,093 | 85,247 | 85,221 | 85,354 | 85,931 | 86,267 |
|
Participation rate |
68.8 | 68.6 | 69.1 | 69.3 | 69.0 | 68.9 | 69.0 | 69.2 | 69.4 |
|
Employed |
80,126 | 81,046 | 81,829 | 81,070 | 81,667 | 81,666 | 81,821 | 82,274 | 82,685 |
|
Employment-population ratio |
65.2 | 65.3 | 65.9 | 66.0 | 66.1 | 66.0 | 66.1 | 66.3 | 66.5 |
|
Unemployed |
4,463 | 4,079 | 3,977 | 4,023 | 3,580 | 3,555 | 3,533 | 3,658 | 3,582 |
|
Unemployment rate |
5.3 | 4.8 | 4.6 | 4.7 | 4.2 | 4.2 | 4.1 | 4.3 | 4.2 |
|
Not in labor force |
38,273 | 39,048 | 38,444 | 37,769 | 38,370 | 38,486 | 38,432 | 38,242 | 37,983 |
|
Men, 20 years and over |
|||||||||
|
Civilian noninstitutional population |
114,375 | 115,669 | 115,748 | 114,375 | 115,120 | 115,212 | 115,292 | 115,669 | 115,748 |
|
Civilian labor force |
81,782 | 82,431 | 83,053 | 82,054 | 82,366 | 82,375 | 82,548 | 82,928 | 83,309 |
|
Participation rate |
71.5 | 71.3 | 71.8 | 71.7 | 71.5 | 71.5 | 71.6 | 71.7 | 72.0 |
|
Employed |
77,781 | 78,761 | 79,552 | 78,515 | 79,248 | 79,324 | 79,431 | 79,705 | 80,213 |
|
Employment-population ratio |
68.0 | 68.1 | 68.7 | 68.6 | 68.8 | 68.9 | 68.9 | 68.9 | 69.3 |
|
Unemployed |
4,002 | 3,670 | 3,501 | 3,539 | 3,118 | 3,050 | 3,117 | 3,223 | 3,096 |
|
Unemployment rate |
4.9 | 4.5 | 4.2 | 4.3 | 3.8 | 3.7 | 3.8 | 3.9 | 3.7 |
|
Not in labor force |
32,592 | 33,238 | 32,695 | 32,321 | 32,755 | 32,837 | 32,745 | 32,741 | 32,440 |
|
Women, 16 years and over |
|||||||||
|
Civilian noninstitutional population |
131,384 | 132,607 | 132,684 | 131,384 | 132,149 | 132,242 | 132,323 | 132,607 | 132,684 |
|
Civilian labor force |
74,893 | 74,912 | 75,688 | 74,904 | 75,124 | 75,312 | 75,243 | 75,183 | 75,654 |
|
Participation rate |
57.0 | 56.5 | 57.0 | 57.0 | 56.8 | 57.0 | 56.9 | 56.7 | 57.0 |
|
Employed |
71,469 | 71,802 | 72,574 | 71,441 | 72,179 | 72,251 | 72,200 | 72,157 | 72,530 |
|
Employment-population ratio |
54.4 | 54.1 | 54.7 | 54.4 | 54.6 | 54.6 | 54.6 | 54.4 | 54.7 |
|
Unemployed |
3,424 | 3,110 | 3,114 | 3,464 | 2,945 | 3,061 | 3,043 | 3,027 | 3,124 |
|
Unemployment rate |
4.6 | 4.2 | 4.1 | 4.6 | 3.9 | 4.1 | 4.0 | 4.0 | 4.1 |
|
Not in labor force |
56,491 | 57,695 | 56,996 | 56,480 | 57,026 | 56,930 | 57,080 | 57,423 | 57,030 |
|
Women, 20 years and over |
|||||||||
|
Civilian noninstitutional population |
123,131 | 124,328 | 124,407 | 123,131 | 123,882 | 123,975 | 124,057 | 124,328 | 124,407 |
|
Civilian labor force |
72,230 | 72,095 | 72,791 | 72,050 | 72,187 | 72,302 | 72,293 | 72,210 | 72,565 |
|
Participation rate |
58.7 | 58.0 | 58.5 | 58.5 | 58.3 | 58.3 | 58.3 | 58.1 | 58.3 |
|
Employed |
69,157 | 69,378 | 70,029 | 68,978 | 69,576 | 69,665 | 69,614 | 69,583 | 69,828 |
|
Employment-population ratio |
56.2 | 55.8 | 56.3 | 56.0 | 56.2 | 56.2 | 56.1 | 56.0 | 56.1 |
|
Unemployed |
3,072 | 2,717 | 2,762 | 3,072 | 2,611 | 2,637 | 2,679 | 2,627 | 2,737 |
|
Unemployment rate |
4.3 | 3.8 | 3.8 | 4.3 | 3.6 | 3.6 | 3.7 | 3.6 | 3.8 |
|
Not in labor force |
50,901 | 52,234 | 51,616 | 51,081 | 51,696 | 51,673 | 51,764 | 52,118 | 51,842 |
|
Both sexes, 16 to 19 years |
|||||||||
|
Civilian noninstitutional population |
16,740 | 16,783 | 16,778 | 16,740 | 16,763 | 16,762 | 16,760 | 16,783 | 16,778 |
|
Civilian labor force |
5,470 | 5,511 | 5,650 | 5,894 | 5,818 | 5,857 | 5,757 | 5,977 | 6,048 |
|
Participation rate |
32.7 | 32.8 | 33.7 | 35.2 | 34.7 | 34.9 | 34.4 | 35.6 | 36.0 |
|
Employed |
4,657 | 4,709 | 4,822 | 5,018 | 5,022 | 4,928 | 4,977 | 5,143 | 5,174 |
|
Employment-population ratio |
27.8 | 28.1 | 28.7 | 30.0 | 30.0 | 29.4 | 29.7 | 30.6 | 30.8 |
|
Unemployed |
813 | 802 | 828 | 876 | 796 | 929 | 780 | 834 | 874 |
|
Unemployment rate |
14.9 | 14.6 | 14.7 | 14.9 | 13.7 | 15.9 | 13.6 | 13.9 | 14.4 |
|
Not in labor force |
11,271 | 11,271 | 11,128 | 10,847 | 10,945 | 10,906 | 11,003 | 10,806 | 10,731 |
|
Footnotes |
|||||||||
|
NOTE: Updated population controls are introduced annually with the release of January data. |
|||||||||
-----
Earlier:

2018, March, 9, 13:05:00
U.S. DEFICIT UP TO $56.6 BLNBEA - The U.S. Census Bureau and the U.S. Bureau of Economic Analysis announced today that the goods and services deficit was $56.6 billion in January, up $2.7 billion from $53.9 billion in December, revised.
|

2018, March, 4, 10:35:00
U.S. GDP UP 2.5%BEA - Real gross domestic product (GDP) increased at an annual rate of 2.5 percent in the fourth quarter of 2017, according to the "second" estimate released by the Bureau of Economic Analysis. In the third quarter, real GDP increased 3.2 percent.
|

2018, February, 16, 23:00:00
U.S. INDUSTRIAL PRODUCTION DOWN 0.1%FRB - Industrial production edged down 0.1 percent in January following four consecutive monthly increases. Manufacturing production was unchanged in January. Mining output fell 1.0 percent, with all of its major component industries recording declines, while the index for utilities moved up 0.6 percent. At 107.2 percent of its 2012 average, total industrial production was 3.7 percent higher in January than it was a year earlier. Capacity utilization for the industrial sector fell 0.2 percentage point in January to 77.5 percent, a rate that is 2.3 percentage points below its long-run (1972–2017) average.
|

2018, February, 7, 07:40:00
U.S. DEFICIT UP TO $53.1 BLNBEA - The U.S. Census Bureau and the U.S. Bureau of Economic Analysis, through the Department of Commerce, announced today that the goods and services deficit was $53.1 billion in December, up $2.7 billion from $50.4 billion in November, revised. December exports were $203.4 billion, $3.5 billion more than November exports. December imports were $256.5 billion, $6.2 billion more than November imports.
|

2018, February, 2, 12:10:00
U.S. FEDERAL FUNDS RATE 1.25 - 1.5%U.S. FRB - In view of realized and expected labor market conditions and inflation, the Committee decided to maintain the target range for the federal funds rate at 1-1/4 to 1‑1/2 percent. The stance of monetary policy remains accommodative, thereby supporting strong labor market conditions and a sustained return to 2 percent inflation.
|

2018, January, 29, 08:20:00
U.S. GDP UP 2.6%BEA - Real gross domestic product (GDP) increased at an annual rate of 2.6 percent in the fourth quarter of 2017 (table 1), according to the "advance" estimate released by the Bureau of Economic Analysis. In the third quarter, real GDP increased 3.2 percent.
|

2018, January, 19, 12:25:00
U.S. SECURITIES INFLOW $33.8 BLNU.S.DT - The sum total in November of all net foreign acquisitions of long-term securities, short-term U.S. securities, and banking flows was a monthly net TIC inflow of $33.8 billion. Of this, net foreign private inflows were $49.7 billion, and net foreign official outflows were $15.9 billion. |


