2018-05-04 15:15:00
U.S. DEFICIT $49.0 BLN
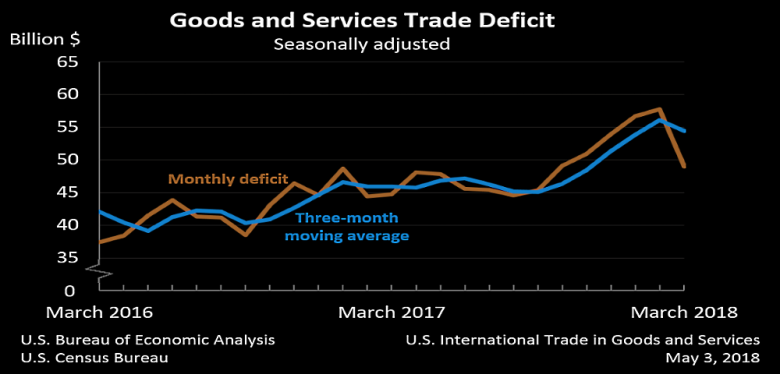
U.S. BEA - The U.S. Census Bureau and the U.S. Bureau of Economic Analysis announced today that the goods and services deficit was $49.0 billion in March, down $8.8 billion from $57.7 billion in February, revised.
Exports, Imports, and Balance
March exports were $208.5 billion, $4.2 billion more than February exports. March imports were $257.5 billion, $4.6 billion less than February imports.
The March decrease in the goods and services deficit reflected a decrease in the goods deficit of $7.5 billion to $69.5 billion and an increase in the services surplus of $1.3 billion to $20.5 billion.
Year-to-date, the goods and services deficit increased $25.5 billion, or 18.5 percent, from the same period in 2017. Exports increased $39.2 billion or 6.8 percent. Imports increased $64.7 billion or 9.1 percent.
Three-Month Moving Averages
The average goods and services deficit decreased $1.7 billion to $54.5 billion for the three months ending in March.
- Average exports increased $1.6 billion to $204.6 billion in March.
- Average imports decreased less than $0.1 billion to $259.1 billion in March.
Year-over-year, the average goods and services deficit increased $8.5 billion from the three months ending in March 2017.
- Average exports increased $13.1 billion from March 2017.
- Average imports increased $21.6 billion from March 2017.
Exports
Exports of goods increased $3.7 billion to $140.9 billion in March.
Exports of goods on a Census basis increased $3.9 billion.
- Capital goods increased $1.9 billion.
- Civilian aircraft increased $1.9 billion.
- Foods, feeds, and beverages increased $1.0 billion.
- Soybeans increased $0.5 billion.
- Corn increased $0.3 billion.
- Industrial supplies and materials increased $0.9 billion.
- Crude oil increased $0.4 billion.
- Other petroleum products increased $0.3 billion.
Net balance of payments adjustments decreased $0.2 billion.
Exports of services increased $0.4 billion to $67.6 billion in March.
- Maintenance and repair services increased $0.1 billion.
- Travel (for all purposes including education) increased $0.1 billion.
- Transport increased $0.1 billion.
Imports
Imports of goods decreased $3.7 billion to $210.4 billion in March.
Imports of goods on a Census basis decreased $3.6 billion.
- Capital goods decreased $1.5 billion.
- Computer accessories decreased $0.5 billion.
- Telecommunications equipment decreased $0.5 billion.
- Semiconductors decreased $0.5 billion.
- Consumer goods decreased $0.9 billion.
- Toys, games, and sporting goods decreased $0.7 billion.
- Televisions and video equipment decreased $0.7 billion.
- Industrial supplies and materials decreased $0.7 billlion.
- Crude oil decreased $0.5 billion.
Net balance of payments adjustments decreased $0.1 billion.
Imports of services decreased $0.9 billion to $47.1 billion in March.
- Charges for the use of intellectual property decreased $0.9 billion. Charges for February included payments for the rights to broadcast the 2018 Winter Olympic Games.
- Transport decreased $0.1 billion.
Real Goods in 2009 Dollars – Census Basis
The real goods deficit decreased $6.9 billion to $62.1 billion in March.
- Real exports of goods increased $3.7 billion to $133.2 billion.
- Real imports of goods decreased $3.1 billion to $195.3 billion.
Revisions
Revisions to February exports
- Exports of goods were revised down less than $0.1 billion.
- Exports of services were revised down less than $0.1 billion.
Revisions to February imports
- Imports of goods were revised down $0.1 billion.
- Imports of services were revised up $0.2 billion.
Goods by Selected Countries and Areas: Monthly – Census Basis
The March figures show surpluses, in billions of dollars, with Hong Kong ($3.3), South and Central America ($3.1), United Kingdom ($1.2), Brazil ($0.8), and Singapore ($0.3). Deficits were recorded, in billions of dollars, with China ($35.4), European Union ($12.4), Mexico ($7.0), Japan ($5.9), Germany ($5.0), Italy ($2.3), France ($1.5), OPEC ($1.4), India ($1.4), Taiwan ($1.3), South Korea ($1.2), Saudi Arabia ($0.3), and Canada ($0.2).
- The deficit with Germany decreased $1.6 billion to $5.0 billion in March. Exports increased $0.4 billion to $5.1 billion and imports decreased $1.2 billion to $10.1 billion.
- The deficit with members of OPEC decreased $0.8 billion to $1.4 billion in March. Exports increased $0.4 billion to $4.9 billion and imports decreased $0.4 billion to $6.3 billion.
- The deficit with China increased $0.7 billion to $35.4 billion in March. Exports increased $1.6 billion to $12.4 billion and imports increased $2.3 billion to $47.7 billion.
-----
Earlier:

2018, April, 30, 10:10:00
U.S. GDP UP 2.3%BEA - Real gross domestic product (GDP) increased at an annual rate of 2.3 percent in the first quarter of 2018 , according to the "advance" estimate released by the Bureau of Economic Analysis. In the fourth quarter, real GDP increased 2.9 percent. |

2018, April, 23, 14:40:00
U.S. OIL DEMAND UP TO 20.6 MBDAPI - the American Petroleum Institute reported that U.S. petroleum demand reached 20.6 million barrels per day (MBD) last month, the highest level since 2007. To satisfy demand, domestic refineries utilized 91.5 percent of their capacity – a record for the month of March – and processed 17 MBD of oil and natural gas liquids (NGLs). The U.S. also produced a record 10.4 MBD of crude oil plus another 3.9 MBD of NGLs. |

2018, April, 18, 13:04:00
U.S. INDUSTRIAL PRODUCTION UP 0.5%FRB - Industrial production rose 0.5 percent in March after increasing 1.0 percent in February; the index advanced 4.5 percent at an annual rate for the first quarter as a whole. After having climbed 1.5 percent in February, manufacturing production edged up 0.1 percent in March. Mining output rose 1.0 percent, mostly as a result of gains in oil and gas extraction and in support activities for mining. The index for utilities jumped 3.0 percent after being suppressed in February by warmer-than-normal temperatures. |

2018, April, 6, 18:10:00
U.S. DEFICIT UP $0.9 BLN TO $57.6 BLNBEA - The U.S. Census Bureau and the U.S. Bureau of Economic Analysis announced that the goods and services deficit was $57.6 billion in February, up $0.9 billion from $56.7 billion in January. |

2018, March, 30, 11:17:00
U.S. GDP UP 2.9%BEA - Real gross domestic product (GDP) increased at an annual rate of 2.9 percent in the fourth quarter of 2017. In the third quarter, real GDP increased 3.2 percent. |

2018, March, 23, 08:20:00
U.S. DEFICIT UP TO $128.2 BLNBEA - The U.S. current-account deficit increased to $128.2 billion (preliminary) in the fourth quarter of 2017 from $101.5 billion (revised) in the third quarter, according to statistics released by the Bureau of Economic Analysis (BEA). The deficit was 2.6 percent of current- dollar gross domestic product (GDP) in the fourth quarter, up from 2.1 percent in the third quarter. |

2018, March, 23, 08:15:00
U.S. FEDERAL FUNDS RATE 1.5 - 1.75%FRB - In view of realized and expected labor market conditions and inflation, the Committee decided to raise the target range for the federal funds rate to 1-1/2 to 1-3/4 percent. The stance of monetary policy remains accommodative, thereby supporting strong labor market conditions and a sustained return to 2 percent inflation. |


