2018-07-27 12:40:00


CHINA'S GDP UP TO 6.9%
IMF - On July 18, 2018, the Executive Board of the International Monetary Fund (IMF) concluded the Article IV consultation with China.
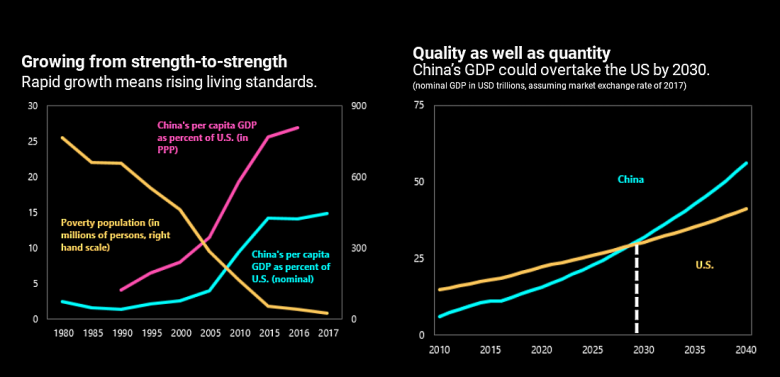
The Chinese economy continues to perform strongly. GDP growth accelerated to 6.9 percent in 2017, driven by a cyclical rebound in global trade. Growth is projected to weaken slightly to 6.6 percent in 2018 owing to the lagged effect of financial regulatory tightening and the softening of external demand. Headline inflation has remained contained at around 2 percent and is expected to rise gradually to 2½ percent.
Reforms progressed in several key areas. A wide range of regulatory reforms reduced financial sector risks, overcapacity reduction progressed, anti-pollution efforts intensified and opening-up accelerated recently.
Credit growth slowed significantly, but remained strong. While the corporate debt to GDP ratio stabilized, total nonfinancial sector debt still rose faster than nominal GDP growth. The deficit of the general government sector (including estimated off-budget investment spending) was estimated to be around 11 percent of GDP in 2017.
The current account surplus fell by 0.4 percentage points to 1.4 percent of GDP in 2017. It is projected to narrow to 0.9 percent of GDP in 2018, driven by deteriorating terms of trade. Net capital outflows declined sharply from $646 billion in 2016 to $73 billion in 2017. The RMB was broadly stable against the basket of currencies in 2017 and was assessed to be broadly in line with fundamentals.
Executive Board Assessment
Executive Directors welcomed the authorities' strategy to decisively shift the policy focus from high-speed to high-quality growth, and commended recent reform progress, in particular, financial de-risking measures and continued opening-up of the economy. They noted that China's growth outlook remains strong and saw this as an opportunity to accelerate rebalancing and other reform efforts, building on the existing agenda.
Directors stressed the importance of staying the course on reining in credit growth. They underscored that the tightening of macro-financial policies should continue while de-emphasizing growth targets. They concurred that continuing financial regulatory reforms, curbing household borrowing, and reining in off-budget local government investment would help deliver a more sustainable growth path.
Directors welcomed the progress in rebalancing the current account, although they noted that some other aspects of rebalancing slowed. They emphasized that progress should be accelerated by more decisive structural reforms to support consumption and reduce income inequality and pollution. In this regard, they looked forward to the authorities' plans to increase social spending and reform pensions. They noted that a more holistic policy framework would help address the tensions across rebalancing dimensions.
Directors agreed that market forces should be allowed to play a more decisive role. In particular, they stressed the need to reduce the dominance of the public sector in some industries, continue to advance state-owned enterprise reforms, open up more markets to the private sector, and ensure fair competition.
Directors welcomed the authorities' strong commitment to free trade and multilateralism. They saw the recently announced package of opening-up policies as being in the right direction and urged the authorities to accelerate reforms in this area. They underscored that trade tensions should be resolved in ways that support and strengthen the international trading system and the global economy.
Directors agreed that further improvements in policy frameworks are needed to implement the authorities' high-quality growth agenda. They supported continuing financial regulatory reforms, a more price-based monetary policy framework, and addressing the misalignment of center-local fiscal responsibilities. In this connection, they welcomed the progress in implementing the FSAP recommendations. Directors also stressed the importance of addressing gaps in China's macroeconomic data. Directors concurred that the success of the Belt and Road Initiative would be enhanced by an overarching framework, better coordination and oversight, more open procurement, and due attention to debt sustainability in partner countries.
Directors took note of the staff's assessment that the renminbi remains broadly in line with fundamentals even as the external position in 2017 was moderately stronger than implied by fundamentals. They welcomed the increase in the flexibility of China's exchange rate, which should continue. Directors concurred that reforms to support the continued easing and removal of capital flow measures and further capital account liberalization should be expedited.
|
China: Selected Economic Indicators |
|||||||||||||||
| 2013 | 2014 | 2015 | 2016 | 2017 | 2018 | 2019 | 2020 | 2021 | 2022 | 2023 | |||||
| Projections | |||||||||||||||
|
NATIONAL ACCOUNTS |
|||||||||||||||
|
Real GDP (base=2015) |
7.8 |
7.3 |
6.9 |
6.7 |
6.9 |
6.6 |
6.4 |
6.3 |
6.0 |
5.7 |
5.5 |
||||
|
Total domestic demand |
8.1 |
7.2 |
7.2 |
7.6 |
6.4 |
6.8 |
6.6 |
6.5 |
6.3 |
6.0 |
5.8 |
||||
|
Consumption |
7.2 |
7.2 |
8.3 |
8.6 |
7.6 |
8.0 |
7.4 |
7.0 |
6.8 |
6.3 |
6.1 |
||||
|
Investment |
9.1 |
7.1 |
6.1 |
6.5 |
4.9 |
5.3 |
5.7 |
5.8 |
5.8 |
5.6 |
5.4 |
||||
|
Fixed |
9.3 |
6.8 |
6.7 |
6.8 |
4.3 |
5.3 |
5.9 |
6.0 |
6.0 |
5.8 |
5.6 |
||||
|
Inventories (contribution) |
0.1 |
0.2 |
-0.2 |
0.0 |
0.3 |
0.1 |
0.0 |
0.0 |
0.0 |
0.0 |
0.0 |
||||
|
Net exports (contribution) |
0.1 |
0.4 |
-0.1 |
-0.6 |
0.6 |
0.0 |
0.0 |
-0.1 |
-0.2 |
-0.2 |
-0.2 |
||||
|
Total capital formation (percent of GDP) |
47.3 |
46.8 |
44.7 |
44.1 |
44.4 |
44.3 |
43.9 |
43.3 |
42.7 |
42.2 |
41.6 |
||||
|
Gross national saving (percent of GDP) 1/ |
48.8 |
49.0 |
47.5 |
45.9 |
45.8 |
45.2 |
44.7 |
44.1 |
43.4 |
42.7 |
42.0 |
||||
|
LABOR MARKET |
|||||||||||||||
|
Unemployment rate (annual average) 2/ |
5.0 |
5.1 |
5.1 |
5.0 |
5.1 |
5.0 |
5.0 |
5.0 |
5.0 |
5.0 |
5.0 |
||||
|
Employment |
0.4 |
0.4 |
0.3 |
0.2 |
0.0 |
0.1 |
0.1 |
0.1 |
0.1 |
0.1 |
0.1 |
||||
|
PRICES |
|||||||||||||||
|
Consumer prices (average) |
2.6 |
2.0 |
1.4 |
2.0 |
1.6 |
2.3 |
2.5 |
2.7 |
2.8 |
2.9 |
3.0 |
||||
|
GDP Deflator |
2.4 |
1.0 |
1.1 |
-0.1 |
1.9 |
2.0 |
2.3 |
2.3 |
2.2 |
2.2 |
2.3 |
||||
|
FINANCIAL |
|||||||||||||||
|
7-day repo rate (percent) |
5.4 |
5.1 |
2.5 |
2.6 |
3.1 |
… |
… |
… |
… |
… |
… |
||||
|
10 year government bond rate (percent) |
4.6 |
3.7 |
2.9 |
3.1 |
3.9 |
… |
… |
… |
… |
… |
… |
||||
|
Real effective exchange rate (average) |
6.3 |
3.1 |
10.1 |
-5.6 |
-2.6 |
… |
… |
… |
… |
… |
… |
||||
|
Nominal effective exchange rate (average) |
5.3 |
3.1 |
9.5 |
-6.5 |
-2.5 |
… |
… |
… |
… |
… |
… |
||||
|
MACRO-FINANCIAL |
|||||||||||||||
|
Total social financing 3/ |
17.5 |
14.3 |
12.4 |
12.9 |
12.0 |
10.5 |
11.5 |
10.9 |
10.1 |
9.5 |
9.2 |
||||
|
In percent of GDP |
180 |
190 |
198 |
209 |
215 |
219 |
224 |
228 |
232 |
235 |
238 |
||||
|
Total nonfinancial sector debt |
17.4 |
17.1 |
15.4 |
16.4 |
14.0 |
12.2 |
12.0 |
11.3 |
10.5 |
9.9 |
9.5 |
||||
|
In percent of GDP |
192 |
207 |
222 |
242 |
253 |
261 |
269 |
275 |
281 |
286 |
290 |
||||
|
Domestic credit to the private sector |
16.6 |
13.2 |
15.8 |
16.5 |
12.8 |
10.6 |
10.6 |
10.1 |
9.4 |
8.8 |
8.5 |
||||
|
In percent of GDP |
142 |
149 |
159 |
174 |
180 |
183 |
186 |
189 |
191 |
192 |
193 |
||||
|
House price 4/ |
7.7 |
1.4 |
9.1 |
11.3 |
5.7 |
8.6 |
8.3 |
7.9 |
7.2 |
6.8 |
6.0 |
||||
|
Household disposable income (percent of GDP) |
59.8 |
60.4 |
60.5 |
61.0 |
60.6 |
61.0 |
61.2 |
61.4 |
61.5 |
61.6 |
61.5 |
||||
|
Household savings (percent of disposable income) |
38.5 |
38.0 |
37.1 |
35.5 |
35.5 |
34.7 |
34.0 |
33.3 |
32.3 |
31.4 |
30.5 |
||||
|
Household debt (percent of GDP) |
33.0 |
35.4 |
38.2 |
44.2 |
49.2 |
51.0 |
52.8 |
54.9 |
56.8 |
59.0 |
61.3 |
||||
|
Non-financial corporate domestic debt (percent of GDP) |
109 |
113 |
121 |
130 |
131 |
132 |
133 |
134 |
134 |
133 |
132 |
||||
|
BIS credit-to-GDP gap (percent of GDP) 5/ |
18.9 |
21.5 |
27.2 |
24.7 |
12.6 |
… |
… |
… |
… |
… |
… |
||||
|
GENERAL GOVERNMENT (Percent of GDP) |
|||||||||||||||
|
Net lending/borrowing 6/ |
-0.8 |
-0.9 |
-2.8 |
-3.7 |
-3.9 |
-4.1 |
-4.1 |
-4.1 |
-4.1 |
-4.1 |
-4.1 |
||||
|
Revenue |
27.7 |
28.1 |
28.5 |
28.2 |
28.4 |
28.8 |
28.9 |
28.6 |
28.3 |
28.2 |
28.0 |
||||
|
Additional financing from land sales |
2.7 |
2.7 |
1.9 |
2.0 |
2.6 |
2.3 |
2.0 |
1.7 |
1.4 |
1.2 |
1.0 |
||||
|
Expenditure |
31.2 |
31.6 |
33.2 |
33.9 |
34.9 |
35.2 |
35.0 |
34.4 |
33.8 |
33.5 |
33.1 |
||||
|
Debt 7/ |
16.0 |
38.6 |
36.4 |
36.7 |
36.9 |
38.1 |
39.3 |
40.4 |
41.4 |
42.4 |
43.2 |
||||
|
Structural balance |
-0.5 |
-0.5 |
-2.5 |
-3.6 |
-4.0 |
-4.2 |
-4.2 |
-4.2 |
-4.2 |
-4.2 |
-4.1 |
||||
|
BALANCE OF PAYMENTS (Percent of GDP) |
|||||||||||||||
|
Current account balance |
1.5 |
2.2 |
2.7 |
1.8 |
1.4 |
0.9 |
0.8 |
0.8 |
0.7 |
0.5 |
0.4 |
||||
|
Trade balance |
3.7 |
4.1 |
5.1 |
4.4 |
4.0 |
3.3 |
3.1 |
2.9 |
2.7 |
2.5 |
2.3 |
||||
|
Services balance |
-1.3 |
-2.0 |
-1.9 |
-2.1 |
-2.2 |
-2.1 |
-2.0 |
-2.0 |
-2.0 |
-1.9 |
-1.9 |
||||
|
Net international investment position |
20.7 |
15.2 |
14.9 |
17.4 |
15.1 |
13.9 |
13.6 |
13.2 |
12.9 |
12.4 |
11.9 |
||||
|
Gross official reserves (bn US$) |
3,880 |
3,899 |
3,406 |
3,098 |
3,236 |
3,198 |
3,144 |
3,088 |
3,024 |
2,935 |
2,809 |
||||
|
MEMORANDUM ITEMS |
|||||||||||||||
|
Nominal GDP (bn RMB) 8/ |
59,696 |
64,718 |
69,911 |
74,563 |
81,204 |
88,282 |
96,107 |
104,434 |
113,132 |
122,194 |
131,915 |
||||
|
Augmented debt (percent of GDP) 9/ |
48.1 |
52.3 |
56.6 |
62.0 |
67.5 |
72.4 |
77.1 |
81.3 |
85.0 |
88.5 |
91.6 |
||||
|
Augmented net lending/borrowing (percent of GDP) 9/ |
-7.6 |
-7.2 |
-8.4 |
-10.4 |
-10.8 |
-10.7 |
-10.9 |
-10.8 |
-10.7 |
-10.4 |
-10.3 |
||||
|
Sources: Bloomberg, CEIC, IMF International Financial Statistics database, and IMF staff estimates and projections. 1/ IMF staff estimates for 2016 and 2017. 2/ Surveyed unemployment rate. 3/ Not adjusted for local government debt swap. 4/ Average selling prices estimated by IMF staff based on housing price data (Commodity Building Residential Price) of 70 large and mid-sized cities published by National Bureau of Statistics (NBS). 5/ Latest observation is for Q3 2017. 6/ Adjustments are made to the authorities' fiscal budgetary balances to reflect consolidated general budgetary government balance, including government-managed funds, state-administered SOE funds, adjustment to the stabilization fund, and social security fund. 7/ Official government debt. Estimates of debt levels before 2015 include central government debt and explicit local government debt (identified by MoF and NPC in Sep 2015). The large increase in general government debt in 2014 reflects the authorities' recognition of the off-budget local government debt borrowed previously. The estimation of debt levels after 2015 assumes zero off-budget borrowing from 2015 to 2021. |
|||||||||||||||
-----
Earlier:

2018, July, 25, 09:30:00
U.S. - CHINA LNG DOWNREUTERS - China, which purchased 14 percent of all U.S. LNG shipped between February 2016-April 2018, has taken delivery from just one vessel that left the United States in May and none in June compared with 14 during the first four months of the year. |

2018, July, 23, 13:40:00
КООПЕРАЦИЯ РОССИИ И КИТАЯМИНЭНЕРГО РОССИИ - «Последовательно реализуются ключевые проекты двустороннего взаимодействия, включая поставки природного газа по «восточному» маршруту и «Ямал СПГ». Ведется кооперация в нефтяной сфере в рамках организации поставок по нефтепроводу «Сковородино-Мохэ». Заинтересованы в участии китайских компаний и в других перспективных проектах, включая Арктик СПГ 2». |

2018, July, 23, 13:35:00
РОССИЯ - КИТАЙ: 3 000 000МИНЭНЕРГО РОССИИ - «Проект реализован в пятистах километрах за Полярным кругом, в месте, где полностью ранее отсутствовала инфраструктура. Для проекта создан флот газовозов ледового класса Arc 7. Запуск первой линии проекта состоялся в декабре прошлого года с опережением графика, выход «Ямал СПГ» на полную мощность – 17,4 млн тонн СПГ в год - намечен на конец 2019 г. К настоящему моменту с проекта уже отгружено около трёх миллионов тонн продукции», - сообщил Александр Новак. |

2018, July, 23, 13:30:00
RUSSIA'S LNG FOR CHINANOVATEK - PAO NOVATEK (“NOVATEK” and/or the “Company”) has shipped its first cargos of liquefied natural gas (LNG) from the Yamal LNG project to China via the Northern Sea Route. |

2018, July, 23, 13:25:00
GLOBAL ENERGY INVESTMENT DOWN 2%IEA - For the third consecutive year, global energy investment declined, to USD 1.8 trillion (United States dollars) in 2017 – a fall of 2% in real terms. The power generation sector accounted for most of this decline, due to fewer additions of coal, hydro and nuclear power capacity, which more than offset increased investment in solar photovoltaics. |

2018, July, 16, 10:35:00
CHINA'S INVESTMENT FOR NIGERIA: $14+3 BLNAN - China National Offshore Oil Corp. (CNOOC) is willing to invest $3 billion in its existing oil and gas operation in Nigeria, the Nigerian National Petroleum Corporation (NNPC) said on Sunday following a meeting with the Chinese in Abuja. |

2018, July, 16, 10:10:00
CHINA'S COAL IMPORTS UP 10%PLATTS - China imported 146 million mt of coal and lignite in the first half of 2018, up 9.9% from the previous year and a three-year high, according to preliminary data released Friday by the General Administration of Customs. In June China imported 25.5 million mt of coal, up 17.9% on the year and 14% on the month from 22.3 million mt in May, the data showed. |

