2018-07-23 13:25:00
U.S. OIL PRODUCTION + 143 TBD, GAS PRODUCTION + 1,066 MCFD
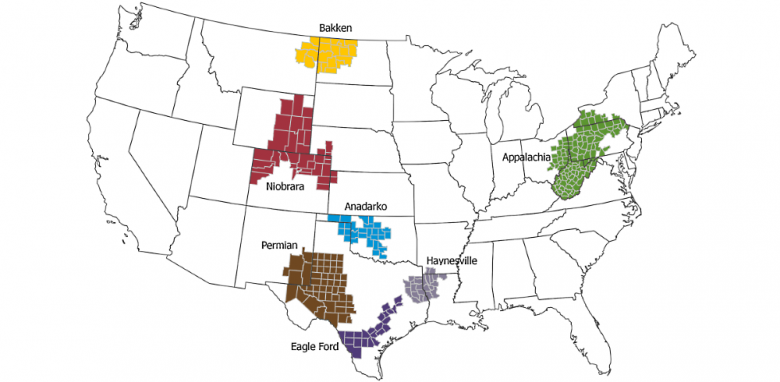
EIA - Crude oil production from the major US onshore regions is forecast to increase 143,000 b/d month-over-month in July from 7,327 to 7,470 thousand barrels/day , gas production to increase 1,066 million cubic feet/day from 69,466 to 70,532 million cubic feet/day .
| Oil production thousand barrels/day |
Gas production million cubic feet/day |
||||||
| Region | July 2018 | August 2018 | change | July 2018 | August 2018 | change | |
| Anadarko | 549 | 559 | 10 | 7,021 | 7,119 | 98 | |
| Appalachia | 114 | 118 | 4 | 28,548 | 28,876 | 328 | |
| Bakken | 1,282 | 1,297 | 15 | 2,400 | 2,425 | 25 | |
| Eagle Ford | 1,401 | 1,436 | 35 | 6,794 | 6,931 | 137 | |
| Haynesville | 43 | 43 | - | 8,949 | 9,138 | 189 | |
| Niobrara | 605 | 611 | 6 | 5,098 | 5,153 | 55 | |
| Permian | 3,333 | 3,406 | 73 | 10,656 | 10,890 | 234 | |
| Total | 7,327 | 7,470 | 143 | 69,466 | 70,532 | 1,066 | |
| New-well oil production per rig barrels/day |
New-well gas production per rig thousand cubic feet/day |
||||||
| Region | July 2018 | August 2018 | change | July 2018 | August 2018 | change | |
| Anadarko | 416 | 419 | 3 | 2,852 | 2,875 | 23 | |
| Appalachia | 145 | 145 | - | 15,770 | 15,914 | 144 | |
| Bakken | 1,469 | 1,476 | 7 | 1,752 | 1,778 | 26 | |
| Eagle Ford | 1,482 | 1,502 | 20 | 5,534 | 5,663 | 129 | |
| Haynesville | 25 | 25 | - | 8,512 | 8,585 | 73 | |
| Niobrara | 1,223 | 1,228 | 5 | 4,543 | 4,578 | 35 | |
| Permian | 623 | 623 | - | 1,206 | 1,206 | - | |
| Total | 678 | 686 | 8 | 3,772 | 3,747 | (25) | |
| Drilled but uncompleted wells (DUC) | |||
| wells | |||
| Region | May 2018 | June 2018 | change |
| Anadarko | 895 | 908 | 13 |
| Appalachia | 753 | 748 | (5) |
| Bakken | 750 | 769 | 19 |
| Eagle Ford | 1,495 | 1,537 | 42 |
| Haynesville | 180 | 182 | 2 |
| Niobrara | 473 | 431 | (42) |
| Permian | 3,204 | 3,368 | 164 |
| Total | 7,750 | 7,943 | 193 |
-----
Earlier:

2018, July, 16, 10:00:00
U.S. RIGS UP 2 TO 1,054BAKER HUGHES A GE - U.S. Rig Count is up 2 rigs from last week to 1,054, with oil rigs unchanged at 863, gas rigs up 2 to 189, and miscellaneous rigs unchanged at 2. Canada Rig Count is up 15 rigs from last week to 197, with oil rigs up 13 to 139 and gas rigs up 2 to 58. |

2018, July, 11, 09:25:00
OIL PRICES 2018 - 19: $73 - $69EIA - Brent crude oil spot prices averaged $74 per barrel (b) in June, a decrease of almost $3/b from the May average. EIA forecasts Brent spot prices will average $73/b in the second half of 2018 and will average $69/b in 2019. EIA expects West Texas Intermediate (WTI) crude oil prices will average $6/b lower than Brent prices in the second half of 2018 and $7/b lower in 2019. NYMEX WTI futures and options contract values for October 2018 delivery that traded during the five-day period ending July 5, 2018, suggest a range of $56/b to $87/b encompasses the market expectation for October WTI prices at the 95% confidence level. |

2018, June, 25, 12:20:00
U.S. OIL UP TO 10.9 MBDWSJ - U.S. production has grown at a record-setting pace this year, hitting 10.9 million barrels a day this month after oil prices exceeded $70 a barrel for the first time since 2014. That makes the U.S. the world’s No. 2 oil producer behind Russia, but ahead of Saudi Arabia. |

2018, June, 20, 12:50:00
U.S. OIL PRODUCTION + 141 TBD, GAS PRODUCTION + 1,135 MCFDEIA - Crude oil production from the major US onshore regions is forecast to increase 141,000 b/d month-over-month in June from 7,198 to 7,339 thousand barrels/day , gas production to increase 1,135 million cubic feet/day from 68,624 to 69,759 million cubic feet/day . |

2018, June, 18, 13:40:00
U.S. RIGS DOWN 3 TO 1,059BAKER HUGHES A GE - U.S. Rig Count is down 3 rigs from last week to 1,059, with oil rigs up 1 to 863, gas rigs down 4 to 194 and miscellaneous rigs unchanged at 2. Canada Rig Count is up 27 rigs from last week to 139, with oil rigs up 18 to 87 and gas rigs up 9 to 52. |

2018, June, 13, 13:10:00
OIL PRICES: 2018 - $71, 2019 - $68EIA - Brent crude oil spot prices averaged $77 per barrel (b) in May, an increase of $5/b from the April level and the highest monthly average price since November 2014. EIA forecasts Brent spot prices will average $71/b in 2018 and $68/b in 2019. The 2019 forecast price is $2/b higher than in the May STEO. EIA expects West Texas Intermediate (WTI) crude oil prices will average almost $7/b lower than Brent prices in 2018 and $6/b lower than Brent prices in 2019
|

2018, June, 8, 13:05:00
U.S. GAS EXPORT UPEIA - U.S. exports of natural gas, including exports via pipeline and as liquefied natural gas (LNG), averaged 9.6 billion cubic feet per day (Bcf/d) in the first quarter of this year, |


