2018-07-27 12:50:00
U.S. OIL INVESTMENT UP, DEBT DOWN
EIA - First-quarter 2018 financial results for the 46 U.S. oil exploration and production companies EIA regularly tracks reveals that they used increased cash from operations to fund capital expenditures and reduce debt. Most of these companies have announced planned increases in capital expenditures from 2017 to 2018 and have already hedged more oil production for 2018 and 2019.
More than 80% of the combined crude oil and other liquids production for these 46 companies was produced in the United States in the first quarter of 2018, accounting for approximately one-third of total U.S. crude oil and natural gas liquids production for the quarter. Because these 46 companies are large and publicly traded companies with a focus on oil production, they can generally be considered representative of the U.S. oil exploration and production industry.
The combined cash from operations for these 46 companies totaled nearly $16 billion in the first quarter of 2018, a year-over-year increase of more than $5 billion (49%). Two significant contributors to the increase in cash from operations were the increases in crude oil prices and in production. West Texas Intermediate (WTI) crude oil spot prices averaged $62.90 per barrel (b) in the first quarter of 2018, a year-over-year increase of $11.27/b (22%). In addition, first-quarter 2018 crude oil and other liquids production for these companies totaled 5.6 million barrels per day (b/d), a year-over-year increase of 0.4 million b/d (7%).
Capital expenditures for these 46 companies totaled almost $19 billion in the first quarter of 2018, a year-over-year increase of nearly $2 billion (10%). Most of these companies have announced that they expect to increase full-year 2018 capital expenditures from 2017 levels.
For the second consecutive quarter, the year-over-year increase in cash from operations has been larger than the growth in capital expenditures, which is the first time this has happened in consecutive quarters since 2013–14 (Figure 1). Although free cash flow (the difference between cash from operations and capital expenditures) remained negative in the first quarter of 2018, it was the lowest among first-quarter comparisons since 2014.

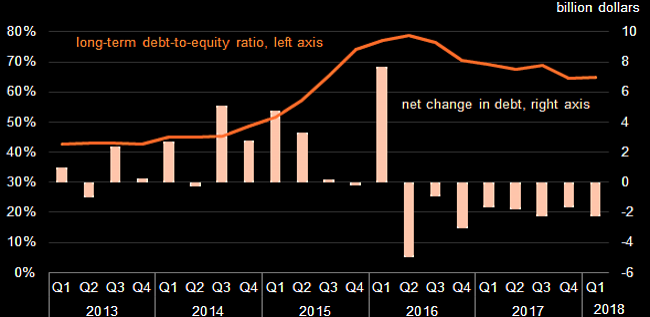
In addition to increased cash from operations, companies have raised cash through net asset sales, equity issuance, and reducing cash balances to pay for capital expenditures. Companies have also used these various sources of cash to reduce debt in recent quarters. In the first quarter of 2018, these companies collectively reduced debt for the eighth consecutive quarter, with a cumulative decline of nearly $19 billion during the past two years (Figure 2). The generally steady reduction in debt has contributed to a decrease in the group's long-term debt-to-equity ratio, which compares companies' ownership levels with their long-term debts. The long-term debt-to-equity ratio, while remaining higher than in 2013 and 2014, declined from a peak of 79% in the second quarter of 2016 to 65% in the fourth quarter of 2017 and the first quarter of 2018.

As of the first quarter of 2018, oil companies have also increased the production volumes hedged for the remainder of 2018 and into 2019. Based on company financial statements, 42 of the 46 companies used derivatives such as futures and options to hedge a collective 1.9 million b/d of 2018 production and 0.7 million b/d of 2019 production at weighted-average prices of $52.28/b and $52.44/b, respectively.
Since the end of the first quarter, however, weekly reports from the Commodity Futures Trading Commission have revealed that from March 27, 2018 (the last data point from the first quarter of 2018) through July 17, 2018, commercial hedging positions declined by 89,376 contracts, the equivalent of nearly 90 million barrels (Figure 3). This trend suggests that producers may have financially settled some of their contracts from the first quarter and not added new hedged volumes for 2018 or 2019 in the second and third quarters of 2018.

Even though hedging is a risk management strategy used to smooth revenue outcomes, the practice cannot insulate producers from rising production expenses, which increased 26% from the first quarter of 2017 to the first quarter of 2018. Production expenses such as the cost of goods sold, operating expenses, and production taxes totaled $24.24 per barrel of oil equivalent in the first quarter of 2018, the largest level since the fourth quarter of 2014 (Figure 4). In addition, some of the financial hedging methods used by several companies resulted in financial losses when crude oil prices increased in the first quarter of 2018. These factors did not appear to limit the growth in cash from operations, however, as the $5 billion increase shown in Figure 1 represented growth of 49% from first-quarter 2017 cash from operations.

WTI crude oil spot prices averaged $68.07/b in the second quarter of 2018, a year-over-year increase of $19.92/b (41%). Higher crude oil prices and continued increases in U.S. crude oil production suggest second-quarter 2018 financial results for these companies could expect to show higher cash from operations. Financial results for the second quarter of 2018 will be released in August.
-----
Earlier:

2018, July, 25, 09:35:00
U.S. OIL PRODUCTION: 10.7 MBDAPI - API released its monthly statistical report for June of 2018 highlighting that U.S. production of crude oil and natural gas liquids hit is highest level ever. In June, production of crude oil hit 10.7 million barrels per day (mb/d) and production of natural gas liquids hit 4.2 mb/d. |

2018, July, 23, 13:25:00
U.S. OIL PRODUCTION + 143 TBD, GAS PRODUCTION + 1,066 MCFDEIA - Crude oil production from the major US onshore regions is forecast to increase 143,000 b/d month-over-month in July from 7,327 to 7,470 thousand barrels/day , gas production to increase 1,066 million cubic feet/day from 69,466 to 70,532 million cubic feet/day . |

2018, July, 23, 13:00:00
U.S. RIGS DOWN 8 TO 1,046BAKER HUGHES A GE - U.S. Rig Count is down 8 rigs from last week to 1,046, with oil down 5 to 858, gas rigs down 2 to 187, and miscellaneous rigs down 1 to 1. Canada Rig Count is up 14 rigs from last week to 211, with oil rigs up 3 to 142 and gas rigs up 11 to 69. |

2018, July, 11, 09:25:00
OIL PRICES 2018 - 19: $73 - $69EIA - Brent crude oil spot prices averaged $74 per barrel (b) in June, a decrease of almost $3/b from the May average. EIA forecasts Brent spot prices will average $73/b in the second half of 2018 and will average $69/b in 2019. EIA expects West Texas Intermediate (WTI) crude oil prices will average $6/b lower than Brent prices in the second half of 2018 and $7/b lower in 2019. NYMEX WTI futures and options contract values for October 2018 delivery that traded during the five-day period ending July 5, 2018, suggest a range of $56/b to $87/b encompasses the market expectation for October WTI prices at the 95% confidence level. |

2018, June, 25, 12:20:00
U.S. OIL UP TO 10.9 MBDWSJ - U.S. production has grown at a record-setting pace this year, hitting 10.9 million barrels a day this month after oil prices exceeded $70 a barrel for the first time since 2014. That makes the U.S. the world’s No. 2 oil producer behind Russia, but ahead of Saudi Arabia. |
|
2018, June, 20, 12:50:00
U.S. OIL PRODUCTION + 141 TBD, GAS PRODUCTION + 1,135 MCFDEIA - Crude oil production from the major US onshore regions is forecast to increase 141,000 b/d month-over-month in June from 7,198 to 7,339 thousand barrels/day , gas production to increase 1,135 million cubic feet/day from 68,624 to 69,759 million cubic feet/day . |

2018, June, 1, 09:25:00
U.S. PRODUCTION: OIL 10.474 MBD, GAS 98,323 MCFDEIA - U.S. oil production up to 10.474 MBD, gas production up to 98,323 MCFD |


