2018-07-25 09:35:00


U.S. OIL PRODUCTION: 10.7 MBD
API - API released its monthly statistical report for June of 2018 highlighting that U.S. production of crude oil and natural gas liquids hit is highest level ever. In June, production of crude oil hit 10.7 million barrels per day (mb/d) and production of natural gas liquids hit 4.2 mb/d.
"Record production U.S. crude oil and natural gas liquids last month highlighted the strength of our nation's energy renaissance," said API Chief Economist Dean Foreman. "U.S. oil production has supplied all of the growth in global oil demand so far this year and helped compensate for production losses in some OPEC nations. With continued increases in drilling activity, the U.S. is poised for further production increases in natural gas and oil. Unfortunately, increasing tariffs on steel and other components that are vital to our industry's infrastructure and operations have emerged as a key challenge. For the energy renaissance to continue, the U.S. natural gas and oil industry critically needs policies that advance energy infrastructure around the country as well as the access of U.S. energy to global markets."
EXECUTIVE SUMMARY
In a remarkable month, the United States natural gas and oil industry scored a hat trick of new records for production, exports and refinery throughput. In June 2018, the U.S. had its highest ever
- Production of crude oil (10.7 million barrels per day, mb/d) and natural gas liquids (NGLs, 4.2 mb/d),
- Exports of crude oil (2.3 mb/d); and,
- Gross inputs to refineries (18.0 mb/d).
Solid economic and energy market fundamentals also underpinned the strongest U.S. petroleum demand since 2007, at 20.6 mb/d. In an attempt to satisfy demand, domestic refineries ran at their highest percent capacity utilization rate in June (96.6 percent) since 2005. With the record refinery throughput, U.S. petroleum inventories held steady as an accumulation of refined product stocks more than offset the drawdown in crude oil stocks.
The global and U.S. economies have had an appetite for U.S. production growth, which has satisfied all global liquids demand growth so far in 2018 and additionally compensated for production losses in some OPEC nations. Continued increases in drilling activity have positioned the U.S. for further increases in natural gas and oil production. To achieve further growth, however, the U.S. natural gas and oil industry critically needs the support of policies that enhance domestic infrastructure and continue to enable access to global markets throughout the energy value chain.
-----
Earlier:

2018, July, 23, 13:25:00
U.S. OIL PRODUCTION + 143 TBD, GAS PRODUCTION + 1,066 MCFDEIA - Crude oil production from the major US onshore regions is forecast to increase 143,000 b/d month-over-month in July from 7,327 to 7,470 thousand barrels/day , gas production to increase 1,066 million cubic feet/day from 69,466 to 70,532 million cubic feet/day . |

2018, July, 23, 13:00:00
U.S. RIGS DOWN 8 TO 1,046BAKER HUGHES A GE - U.S. Rig Count is down 8 rigs from last week to 1,046, with oil down 5 to 858, gas rigs down 2 to 187, and miscellaneous rigs down 1 to 1. Canada Rig Count is up 14 rigs from last week to 211, with oil rigs up 3 to 142 and gas rigs up 11 to 69. |

2018, July, 11, 09:25:00
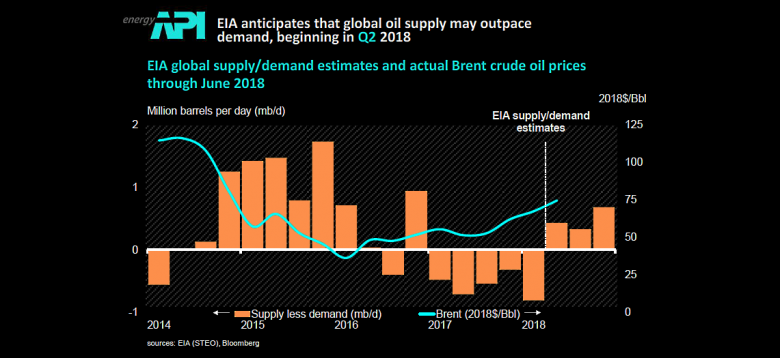
OIL PRICES 2018 - 19: $73 - $69EIA - Brent crude oil spot prices averaged $74 per barrel (b) in June, a decrease of almost $3/b from the May average. EIA forecasts Brent spot prices will average $73/b in the second half of 2018 and will average $69/b in 2019. EIA expects West Texas Intermediate (WTI) crude oil prices will average $6/b lower than Brent prices in the second half of 2018 and $7/b lower in 2019. NYMEX WTI futures and options contract values for October 2018 delivery that traded during the five-day period ending July 5, 2018, suggest a range of $56/b to $87/b encompasses the market expectation for October WTI prices at the 95% confidence level. |

2018, June, 25, 12:20:00
U.S. OIL UP TO 10.9 MBDWSJ - U.S. production has grown at a record-setting pace this year, hitting 10.9 million barrels a day this month after oil prices exceeded $70 a barrel for the first time since 2014. That makes the U.S. the world’s No. 2 oil producer behind Russia, but ahead of Saudi Arabia.
|

2018, June, 20, 12:55:00
U.S. OIL FOR CHINAPLATTS - Since the US dropped all limits on crude exports in 2015, China has competed with Canada as the top buyer of US crude. US crude exports to China averaged over 358,000 b/d in the first quarter, up from nearly 175,000 b/d in Q1 2017. US crude's market share in China rose to 3.5% from 0.4% over the same period.
|

2018, June, 4, 13:25:00
U.S. ENERGY THREATAPI - “The implementation of new tariffs will disrupt the U.S. oil and natural gas industry’s complex supply chain, compromising ongoing and future U.S. energy projects, which could weaken our national security. Additionally, Canada, Mexico and the European Union are imperative members of our Defense Industrial Base (DIB) and are top military allies – far from a threat to America’s security. |

2018, June, 1, 09:25:00
U.S. PRODUCTION: OIL 10.474 MBD, GAS 98,323 MCFDEIA - U.S. oil production up to 10.474 MBD, gas production up to 98,323 MCFD |


