2018-08-03 09:15:00


SOUTH AFRICA: NEGATIVE GROWTH
IMF - On July 25, 2018, the Executive Board of the International Monetary Fund concluded the Article IV consultation with South Africa.
Amid a marked growth deceleration, some of South Africa's economic and social achievements after the end of apartheid have recently unwound. While the economy is globally positioned, sophisticated, and diversified, gaps in physical infrastructure and education create large productivity differentials across sectors. Low consumer and business confidence has dampened productivity growth. Fast growing debt has constrained policy space. As a result, per-capita growth has turned negative, the poverty rate stands at around 40 percent, unemployment has crept up to 27 percent—almost twice that level for the youth—and income inequality is one of the highest globally.
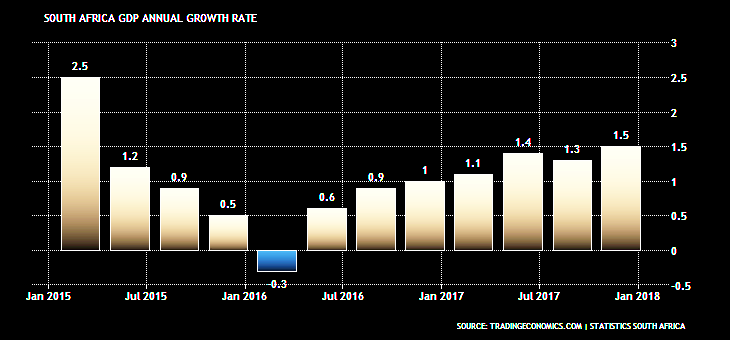
Fiscal and monetary policies were eased, but growth remained subdued. The FY17/18 consolidated fiscal deficit is estimated to have expanded to 4.8 percent of GDP from 4 percent of GDP in FY16/17. Monetary policy was eased by a total of 50 basis points, in July 2017 and March 2018. Nonetheless, GDP growth edged up only slightly from 0.6 percent in 2016 to 1.3 percent in 2017. Major obstacles to growth included a regulatory environment not conducive to private investment, inefficiencies in SOEs increasing the cost of key inputs, labor market rigidities, insufficient competition in product markets, corruption, and policy uncertainty. Inflation moderated to 5.3 percent and the current account deficit narrowed to 2.5 percent of GDP in 2017.
The recent political transition offers a renewed opportunity to advance reforms and exploit the economy's potential. The stated priorities of the new administration—combating "state capture" and promoting jobs and growth—point in the right direction.
On current policies, staff projects a modest growth recovery to 1.5 percent in 2018 and 1.8 percent in the outer years, slightly above population growth. Inflation is projected to ease to 4.9 percent in 2018 and edge higher to 5.5 percent in the outer years. The current account deficit is expected to widen to 2.9 percent of GDP in 2018 and to around 3½ percent of GDP over the medium term.
This baseline scenario is subject to upside developments, but downside risks seem more prominent. Should structural bottlenecks be addressed, South Africa has broad-based potential to boost growth significantly, aided by deep and liquid financial markets, a solid domestic investor base, a floating exchange rate, and limited susceptibility to exchange rate risk (low foreign currency exposures) and rollover risk (long debt maturities and access to segments of the global financial safety net). However, significant vulnerabilities arise from fiscal risks related to weak and poorly managed state-owned enterprises and other spending pressures. External risks include large gross external financing needs, and a current account deficit financed by flows that are prone to sudden reversals in response to abrupt changes in global financial conditions and sovereign credit ratings. Disruption in trade flows and a fall in commodity prices would worsen the twin deficits and dampen growth.
Executive Board Assessment
Directors acknowledged that South Africa has achieved important progress after the end of apartheid, supported by strong economic institutions, but observed that unemployment and inequality remain high. They welcomed the measures announced by the new administration to improve governance and reignite business and consumer confidence. They encouraged the authorities to leverage the opportunity provided by the recent political transition to advance the reform agenda in a well-sequenced manner.
Directors urged the authorities to deepen the fight against corruption and advance the ambitious reforms in product and labor markets to raise productivity and enhance private sector participation. They recommended the forceful application of the Public Financial Management Act to increase deterrence against corruption. Directors called for the completion of measures in the telecommunications and mining sectors to attract higher private investment and create employment. They noted that further progress is needed to contain fiscal risks from state-owned enterprises and rethink the business models, including by engaging in strategic equity partnerships with the private sector. Directors stressed that improved competitiveness and higher growth are critical for poverty reduction in South Africa. Enhancing education quality and labor market flexibility and leveraging the opportunities provided by digitalization will boost efficiency and support growth.
Directors underscored that fiscal policy needs to focus on containing the rise in public debt and building buffers against potential shocks. Reducing the high wage bill, improving the quality of expenditure, and strengthening tax administration would contribute to this objective and strengthen the role of fiscal policy in addressing inequality. Some Directors noted that the primary expenditure ceiling could usefully be accompanied by a debt ceiling.
Directors commended the South African Reserve Bank's effective inflation targeting, and welcomed the Bank's intention to lower inflation toward the midpoint of the official target band. They noted that low and stable inflation would benefit poorer households more, who tend to face the largest burden of high inflation. Directors emphasized that monetary policy should remain cautious, paying attention to fiscal policy and upside inflation risks.
Directors commended South Africa's resilience to recent market volatility, which has been supported mainly by the floating exchange rate. They advised further enhancing this resilience by advancing structural reforms to attract more durable foreign investment, and opportunistically increasing international reserves.
Directors welcomed the introduction of the Twin Peaks approach, which strengthens financial sector oversight and cross-agency coordination. They took positive note that the banking system remains sound, but stressed that continued vigilance will be important in light of pockets of vulnerabilities in small and medium-sized banks. Directors welcomed the authorities' continued efforts to upgrade stress-testing capabilities. They recommended continuing efforts to enhance financial inclusion, including through the promotion of entry of new financial institutions and technological solutions, as well as increase competition.
|
Social Indicators |
||||||||
|
GDP |
Poverty (percent of population) |
|||||||
|
Nominal GDP (2016, billions of US dollars) |
295 |
Headcount ratio at $1.90 a day (2011 PPP) |
16.6 |
|||||
|
GDP per capita (2016, in US dollars) |
5,311 |
Undernourishment (2015) |
5.0 |
|||||
|
Population Characteristics |
Inequality (income shares unless otherwise specified) |
|||||||
|
Total (2016, million) |
55.6 |
Highest 10 percent of population |
51.3 |
|||||
|
Urban population (2014, percent of total) |
64 |
Lowest 20 percent of population |
2.5 |
|||||
|
Life expectancy at birth (2016, number of years) |
62 |
Gini coefficient (2010) |
63.4 |
|||||
|
Economic Indicators |
||||||||
|
2014 |
2015 |
2016 |
2017 |
2018 |
2019 |
|||
|
Est. |
Proj. |
Proj. |
||||||
|
National income and prices (annual percentage change unless otherwise indicated) |
||||||||
|
Real GDP |
1.8 |
1.3 |
0.6 |
1.3 |
1.5 |
1.7 |
||
|
Real GDP per Capita |
0.3 |
-0.3 |
-1.0 |
-0.3 |
-0.1 |
0.1 |
||
|
Real domestic demand |
0.5 |
2.1 |
-0.9 |
1.8 |
1.6 |
1.9 |
||
|
GDP deflator |
5.5 |
5.1 |
6.8 |
5.5 |
4.9 |
5.3 |
||
|
CPI (annual average) |
6.1 |
4.6 |
6.3 |
5.3 |
4.9 |
5.3 |
||
|
CPI (end of period) |
5.3 |
5.3 |
6.7 |
4.7 |
5.3 |
5.3 |
||
|
Labor Market (annual percentage change unless otherwise indicated) |
||||||||
|
Unemployment Rate (percent of labor force, annual average) |
25.1 |
25.4 |
26.7 |
27.5 |
27.9 |
28.3 |
||
|
Average remuneration (formal nonagricultural, normal) |
6.6 |
7.0 |
5.8 |
7.1 |
6.7 |
7.1 |
||
|
Labor productivity (formal nonagricultural) |
1.5 |
1.8 |
0.5 |
1.8 |
1.8 |
1.8 |
||
|
Unit labor costs (formal nonagricultural) |
5.1 |
5.2 |
5.2 |
5.3 |
4.9 |
5.3 |
||
|
Savings and Investment (percent of GDP) |
||||||||
|
Gross national saving |
15.4 |
16.4 |
16.6 |
16.1 |
15.6 |
15.4 |
||
|
Public (incl. public enterprises) |
1.1 |
1.0 |
0.8 |
0.3 |
0.5 |
0.6 |
||
|
Private |
14.3 |
15.3 |
15.7 |
15.8 |
15.1 |
14.8 |
||
|
Investment (including inventories) |
20.5 |
21.0 |
19.4 |
18.6 |
18.5 |
18.7 |
||
|
Public (incl. public enterprises) |
6.9 |
7.4 |
7.2 |
6.9 |
6.9 |
6.8 |
||
|
Private |
13.5 |
13.0 |
12.3 |
11.8 |
11.8 |
12.0 |
||
|
Fiscal position (percent of GDP unless otherwise indicated) 1/ |
||||||||
|
Revenue, including grants 2/ |
27.6 |
28.1 |
28.6 |
28.3 |
29.0 |
29.5 |
||
|
Expenditure and net lending |
31.9 |
32.9 |
32.7 |
32.9 |
33.3 |
33.6 |
||
|
Overall balance |
-4.3 |
-4.8 |
-4.1 |
-4.6 |
-4.3 |
-4.0 |
||
|
Primary balance |
-1.2 |
-1.5 |
-0.6 |
-1.0 |
-0.5 |
0.0 |
||
|
Structural balance (percent of potential GDP) |
-4.1 |
-4.1 |
-3.8 |
-3.9 |
-3.7 |
-3.5 |
||
|
Gross government debt 2/ |
47.0 |
49.3 |
51.6 |
53.0 |
55.0 |
56.0 |
||
|
Government bond yield (10-year, percent) 4/ |
8.0 |
9.7 |
8.9 |
9.2 |
8.6 |
n.a. |
||
|
Money and credit (annual percentage change unless otherwise indicated) |
||||||||
|
Broad money |
7.2 |
10.5 |
6.1 |
6.9 |
6.4 |
7.1 |
||
|
Credit to the private sector |
7.2 |
8.0 |
4.7 |
4.3 |
5.6 |
6.3 |
||
|
Repo rate (percent, end-period) |
5.8 |
6.3 |
7.0 |
6.8 |
6.5 |
n.a. |
||
|
3-month Treasury bill interest rate (percent) 4/ |
5.8 |
6.1 |
7.2 |
7.3 |
7.1 |
n.a. |
||
|
Balance of payments |
||||||||
|
Current account balance (billions of U.S. dollars) |
-17.8 |
-14.6 |
-8.2 |
-8.6 |
-11.0 |
-12.7 |
||
|
percent of GDP |
-5.1 |
-4.6 |
-2.8 |
-2.5 |
-2.9 |
-3.3 |
||
|
Exports growth (volume) |
3.6 |
2.8 |
1.0 |
-0.1 |
3.7 |
3.4 |
||
|
Imports growth (volume) |
-0.6 |
5.4 |
-3.8 |
1.9 |
4.0 |
3.9 |
||
|
Terms of trade |
-1.5 |
3.0 |
1.4 |
4.7 |
-2.7 |
-1.3 |
||
|
Overall balance (percent of GDP) |
0.4 |
-0.3 |
0.9 |
0.5 |
0.2 |
-0.2 |
||
|
Gross reserves (billions of U.S. dollars) |
49.1 |
45.8 |
47.4 |
50.7 |
51.5 |
50.7 |
||
|
Total external debt (percent of GDP) |
41.3 |
39.1 |
48.3 |
49.6 |
46.1 |
47.0 |
||
|
Nominal effective exchange rate (period average) 5/ |
-10.2 |
-4.0 |
-11.9 |
11.8 |
n.a. |
n.a. |
||
|
Real effective exchange rate (period average) 6/ |
-6.2 |
-0.5 |
-7.1 |
12.7 |
n.a. |
n.a. |
||
|
Exchange rate (Rand/U.S. dollar, end-period) 7/ |
11.6 |
15.6 |
13.7 |
12.3 |
n.a. |
n.a. |
||
|
Sources: South African Reserve Bank, National Treasury, Haver, Bloomberg, L.P., World Bank, and Fund staff estimates and projections. 1/ Consolidated government as defined in the budget unless otherwise indicated. 2/ Revenue excludes "transactions in assets and liabilities" classified as part of revenue in budget documents. This item represents proceeds from the sales of assets, realized valuation gains from holding of foreign currency deposits, and other conceptually similar items, which are not classified as revenue by the IMF's Government Finance Statistics Manual 2010. 3/ Central government. 4/ January-September 2017 average. 5/ January-August 2017 average with respect to 2016 average. 6/ January-July 2017 average with respect to 2016 average. 7/ September 2017. |
||||||||
-----
Earlier:

2018, June, 18, 13:45:00
SOUTH AFRICA: NO BENEFITSIMF - South Africa’s potential is significant, yet growth over the past five years has not benefitted from the global recovery. The economy is globally positioned, sophisticated, and diversified, and several sectors—agribusiness, mining, manufacturing, and services—have capacity for expansion. Combined with strong institutions and a young workforce, opportunities are vast. However, several constraints have held growth back. Policy uncertainty and a regulatory environment not conducive to private investment have resulted in GDP growth rates that have not kept up with those of population growth, reducing income per capita, and hurting disproportionately the poor. |

2018, February, 7, 07:20:00
SOUTH AFRICA'S EXPLORATIONTOTAL - Total has signed an agreement to sell a 25% interest in the Exploration Block 11B/12B, offshore South Africa, to Qatar Petroleum. The transaction remains subject to regulatory approval.
|

2018, February, 2, 12:05:00
SOUTH AFRICA'S GAS UPEIA - South Africa is one of the world’s leading emitters of energy-related carbon dioxide (CO2), ranking fifteenth globally in 2015 and accounting for more than any other country in Africa. In an effort to reduce CO2 emissions, South Africa is planning to diversify its energy portfolio, replacing coal with lower CO2-emitting fuels such as natural gas and renewable sources. The country’s Intended National Determined Contribution, submitted as part of the Paris Agreement, plans for CO2 emissions to peak by 2025, remain flat for a decade, and begin to decline around 2035. |

2016, July, 8, 18:25:00
WBG: GLOBAL GROWTH DOWN TO 2.4%The World Bank is downgrading its 2016 global growth forecast to 2.4 percent from the 2.9 percent pace projected in January. The move is due to sluggish growth in advanced economies, stubbornly low commodity prices, weak global trade, and diminishing capital flows. |

2016, June, 7, 18:35:00
SOUTH AFRICA UPGRADE: $2.7 BLN“South Africa’s oil refineries are not ready and will not be ready to produce Euro 4 standard fuel, let alone Euro 6, which the world is moving to by 2017 or 2020 in preparation for the introduction of more fuel-efficient vehicles,” he said in an opinion piece in Johannesburg-based Business Report newspaper Tuesday. “Our present crude-oil stocks are suitable for producing products of lower specifications, which means we need to stockpile higher-quality grades of crude oil.” |


