2018-08-13 13:25:00
U.S. RIGS UP 13 TO 1,057
BAKER HUGHES A GE - U.S. Rig Count is up 13 rigs from last week to 1,057, with oil rigs up 10 to 869, gas rigs up 3 to 186, and miscellaneous rigs unchanged at 2.
U.S. Rig Count is up 108 rigs from last year's count of 949, with oil rigs up 101, gas rigs up 5, and miscellaneous rigs up 2.
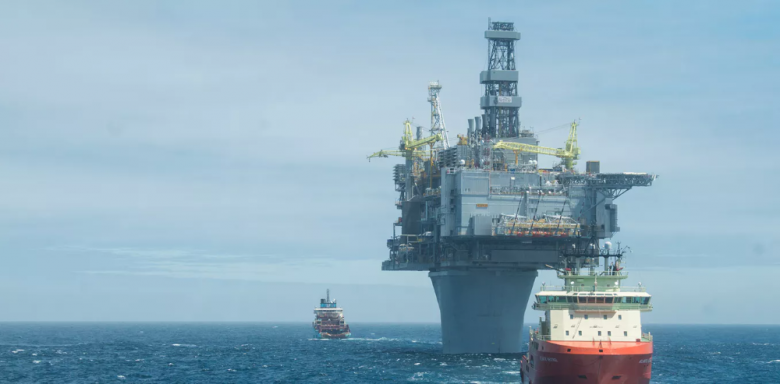
The U.S. Offshore Rig Count is up 3 rigs to 20 and up 2 rigs year-over-year.
Canada Rig Count is down 14 rigs from last week to 209, with oil rigs down 12 to 140 and gas rigs down 2 to 69.
Canada Rig Count is down 11 rigs from last year's count of 220, with oil rigs up 13 and gas rigs down 24.
| Rotary Rig Count | |||||||||
| 8/10/18 | |||||||||
| Week | Year | ||||||||
| Location | Week | +/- | Ago | +/- | Ago | ||||
| Land | 1035 | 10 | 1025 | 107 | 928 | ||||
| Inland Waters | 2 | 0 | 2 | -1 | 3 | ||||
| Offshore | 20 | 3 | 17 | 2 | 18 | ||||
| United States Total | 1057 | 13 | 1044 | 108 | 949 | ||||
| Gulf Of Mexico | 18 | 2 | 16 | 1 | 17 | ||||
| Canada | 209 | -14 | 223 | -11 | 220 | ||||
| North America | 1266 | -1 | 1267 | 97 | 1169 | ||||
| U.S. Breakout Information | This Week | +/- | Last Week | +/- | Year Ago | ||||
| Oil | 869 | 10 | 859 | 101 | 768 | ||||
| Gas | 186 | 3 | 183 | 5 | 181 | ||||
| Miscellaneous | 2 | 0 | 2 | 2 | 0 | ||||
| Directional | 64 | 0 | 64 | -12 | 76 | ||||
| Horizontal | 924 | 12 | 912 | 123 | 801 | ||||
| Vertical | 69 | 1 | 68 | -3 | 72 | ||||
| Canada Breakout Information | This Week | +/- | Last Week | +/- | Year Ago | ||||
| Oil | 140 | -12 | 152 | 13 | 127 | ||||
| Gas | 69 | -2 | 71 | -24 | 93 | ||||
| Major State Variances | This Week | +/- | Last Week | +/- | Year Ago | ||||
| Alaska | 7 | 2 | 5 | 1 | 6 | ||||
| Arkansas | 0 | -1 | 1 | -1 | 1 | ||||
| California | 16 | 1 | 15 | 2 | 14 | ||||
| Colorado | 30 | 0 | 30 | -7 | 37 | ||||
| Kansas | 0 | -1 | 1 | 0 | 0 | ||||
| Louisiana | 59 | 6 | 53 | -7 | 66 | ||||
| New Mexico | 107 | 5 | 102 | 46 | 61 | ||||
| North Dakota | 56 | 0 | 56 | 3 | 53 | ||||
| Ohio | 23 | 1 | 22 | -5 | 28 | ||||
| Oklahoma | 139 | 2 | 137 | 7 | 132 | ||||
| Pennsylvania | 39 | -1 | 40 | 5 | 34 | ||||
| Texas | 522 | -2 | 524 | 63 | 459 | ||||
| Utah | 6 | 0 | 6 | -4 | 10 | ||||
| West Virginia | 14 | 0 | 14 | 0 | 14 | ||||
| Wyoming | 30 | 0 | 30 | 4 | 26 | ||||
| Major Basin Variances | This Week | +/- | Last Week | +/- | Year Ago | ||||
| Ardmore Woodford | 2 | 0 | 2 | 1 | 1 | ||||
| Arkoma Woodford | 6 | -1 | 7 | -2 | 8 | ||||
| Barnett | 2 | -1 | 3 | -5 | 7 | ||||
| Cana Woodford | 68 | 0 | 68 | 5 | 63 | ||||
| DJ-Niobrara | 25 | 0 | 25 | -5 | 30 | ||||
| Eagle Ford | 79 | -1 | 80 | 4 | 75 | ||||
| Fayetteville | 0 | 0 | 0 | -1 | 1 | ||||
| Granite Wash | 17 | 1 | 16 | 2 | 15 | ||||
| Haynesville | 49 | 1 | 48 | 4 | 45 | ||||
| Marcellus | 52 | -1 | 53 | 6 | 46 | ||||
| Mississippian | 6 | 0 | 6 | -1 | 7 | ||||
| Permian | 485 | 5 | 480 | 108 | 377 | ||||
| Utica | 24 | 1 | 23 | -5 | 29 | ||||
| Williston | 56 | 0 | 56 | 3 | 53 | ||||
-----
Earlier:

2018, August, 6, 12:40:00
U.S. RIGS DOWN 4 TO 1,044BAKER HUGHES A GE - U.S. Rig Count is down 4 rigs from last week to 1,044, with oil rigs down 2 to 859, gas rigs down 3 to 183, and miscellaneous rigs up 1 to 2. Canada Rig Count is unchanged from last week at 223 rigs, with oil rigs down 2 to 152 and gas rigs up 2 to 71.
|

2018, August, 1, 09:30:00
U.S. ENERGY EFFICIENCY UPU.S. EIA - U.S. energy expenditures declined for the fifth consecutive year, reaching $1.0 trillion in 2016, a 9% decrease in real terms from 2015. Adjusted for inflation, total energy expenditures in 2016 were the lowest since 2003. Expressed as a percent of gross domestic product (GDP), total energy expenditures were 5.6% in 2016, the lowest since at least 1970. |

2018, July, 30, 13:10:00
U.S. RIGS UP 2 TO 1,048BAKER HUGHES A GE - U.S. Rig Count is up 2 rigs from last week to 1,048, with oil up 3 to 861, gas rigs down 1 to 186, and miscellaneous rigs unchanged at 1. Canada Rig Count is up 12 rigs from last week to 223, with oil rigs up 12 to 154 and gas rigs unchanged at 69.
|

2018, July, 27, 12:50:00
U.S. OIL INVESTMENT UP, DEBT DOWNEIA - Capital expenditures for these 46 companies totaled almost $19 billion in the first quarter of 2018, a year-over-year increase of nearly $2 billion (10%). Most of these companies have announced that they expect to increase full-year 2018 capital expenditures from 2017 levels. |

2018, July, 27, 12:45:00
U.S. OIL TO CHINA DOWNPLATTS - China's crude oil imports from the US for July have fallen sharply from June, and are expected to drop even further for August, vessel tracking data showed, as Beijing's tariffs on US crude imports get closer to implementation. |

2018, July, 27, 12:25:00
BP GAS INVESTMENT $10.5 BLNBP - “This is a transformational acquisition for our Lower 48 business, a major step in delivering our Upstream strategy and a world-class addition to BP’s distinctive portfolio. Given our confidence in BP’s future – further bolstered by additional earnings and cash flow from this deal – we are increasing the dividend, reflecting our long-standing commitment to growing distributions to shareholders. |

2018, July, 25, 09:35:00
U.S. OIL PRODUCTION: 10.7 MBDAPI - API released its monthly statistical report for June of 2018 highlighting that U.S. production of crude oil and natural gas liquids hit is highest level ever. In June, production of crude oil hit 10.7 million barrels per day (mb/d) and production of natural gas liquids hit 4.2 mb/d. |


