2018-08-06 13:15:00
U.S. DEFICIT UP $3.2 BLN TO $46.3 BLN
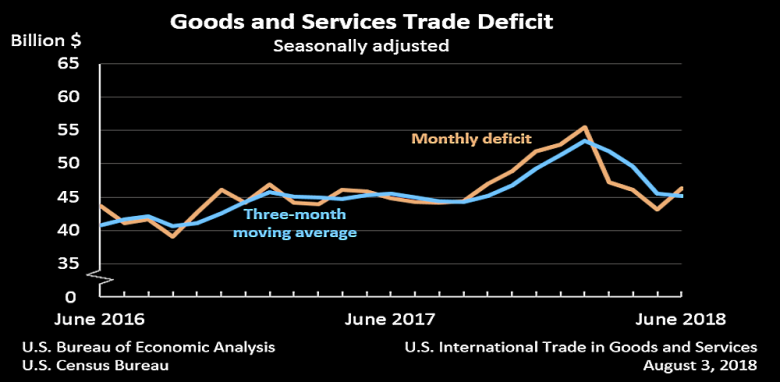
U.S. BEA - The U.S. Census Bureau and the U.S. Bureau of Economic Analysis announced today that the goods and services deficit was $46.3 billion in June, up $3.2 billion from $43.2 billion in May, revised.
June exports were $213.8 billion, $1.5 billion less than May exports. June imports were $260.2 billion, $1.6 billion more than May imports.
The June increase in the goods and services deficit reflected an increase in the goods deficit of $3.1 billion to $68.8 billion and a decrease in the services surplus of less than $0.1 billion to $22.5 billion.
Year-to-date, the goods and services deficit increased $19.6 billion, or 7.2 percent, from the same period in 2017. Exports increased $103.6 billion or 9.0 percent. Imports increased $123.2 billion or 8.6 percent.
Three-Month Moving Averages
The average goods and services deficit decreased $0.3 billion to $45.2 billion for the three months ending in June.
* Average exports increased $1.0 billion to $213.5 billion in June.
* Average imports increased $0.8 billion to $258.7 billion in June.
Year-over-year, the average goods and services deficit decreased $0.4 billion from the three months ending in June 2017.
* Average exports increased $20.2 billion from June 2017.
* Average imports increased $19.9 billion from June 2017.
Exports
Exports of goods decreased $1.7 billion to $143.2 billion in June.
Exports of goods on a Census basis decreased $1.7 billion.
* Consumer goods decreased $1.4 billion.
o Pharmaceutical preparations decreased $0.6 billion.
o Jewelry decreased $0.4 billion.
* Capital goods decreased $0.9 billion.
o Civilian aircraft engines decreased $0.4 billion.
o Civilian aircraft decreased $0.2 billion.
* Automotive vehicles, parts, and engines decreased $0.7 billion.
o Passenger cars decreased $0.9 billion.
* Industrial supplies and materials increased $2.0 billion.
o Other petroleum products increased $0.5 billion.
o Nonmonetary gold increased $0.5 billion.
o Fuel oil increased $0.5 billion.
Net balance of payments adjustments increased less than $0.1 billion.
Exports of services increased $0.2 billion to $70.6 billion in June.
* Financial services increased $0.1 billion.
Imports
Imports of goods increased $1.4 billion to $212.0 billion in June.
Imports of goods on a Census basis increased $1.5 billion.
* Consumer goods increased $2.0 billion.
o Pharmaceutical preparations increased $1.5 billion.
* Industrial supplies and materials increased $0.9 billion.
o Crude oil increased $1.2 billion.
* Capital goods decreased $1.5 billion.
o Computers decreased $0.8 billion.
o Telecommunications equipment decreased $0.5 billion.
Net balance of payments adjustments decreased $0.1 billion.
Imports of services increased $0.2 billion to $48.1 billion in June.
* Charges for the use of intellectual property increased $0.3 billion. The increase reflects payments for the rights to broadcast the portion of the 2018 soccer World Cup that occurred in June.
-----
Earlier:

2018, August, 3, 09:25:00
U.S. FEDERAL FUNDS RATE 1.75 - 2%U.S. FRB - In view of realized and expected labor market conditions and inflation, the Committee decided to maintain the target range for the federal funds rate at 1-3/4 to 2 percent. The stance of monetary policy remains accommodative, thereby supporting strong labor market conditions and a sustained return to 2 percent inflation. |

2018, August, 1, 09:30:00
U.S. ENERGY EFFICIENCY UPU.S. EIA - U.S. energy expenditures declined for the fifth consecutive year, reaching $1.0 trillion in 2016, a 9% decrease in real terms from 2015. Adjusted for inflation, total energy expenditures in 2016 were the lowest since 2003. Expressed as a percent of gross domestic product (GDP), total energy expenditures were 5.6% in 2016, the lowest since at least 1970. |

2018, August, 1, 09:20:00
U.S. INVESTMENT UP $427.3 BLN/ $260.4 BLNU.S. BEA - The U.S. direct investment abroad position, or cumulative level of investment, increased $427.3 billion to $6,013.3 billion at the end of 2017 from $5,586.0 billion at the end of 2016, the foreign direct investment in the United States position increased $260.4 billion to $4,025.5 billion at the end of 2017 from $3,765.1 billion at the end of 2016. |

2018, July, 30, 13:35:00
U.S. GDP UP 4.1%U.S. BEA - Real gross domestic product increased at an annual rate of 4.1 percent in the second quarter of 2018 , according to the "advance" estimate released by the Bureau of Economic Analysis. In the first quarter, real GDP increased 2.2 percent. |

2018, July, 27, 12:50:00
U.S. OIL INVESTMENT UP, DEBT DOWNEIA - Capital expenditures for these 46 companies totaled almost $19 billion in the first quarter of 2018, a year-over-year increase of nearly $2 billion (10%). Most of these companies have announced that they expect to increase full-year 2018 capital expenditures from 2017 levels. |

2018, July, 23, 13:20:00
U.S. INDUSTRIAL PRODUCTION UP 0.6%U.S. FRB - Industrial production rose 0.6 percent in June after declining 0.5 percent in May. For the second quarter as a whole, industrial production advanced at an annual rate of 6.0 percent, its third consecutive quarterly increase. Manufacturing output moved up 0.8 percent in June. |

2018, July, 23, 13:15:00
U.S. INVESTMENT $69.9 BLNU.S. DT - The sum total in May of all net foreign acquisitions of long-term securities, short-term U.S. securities, and banking flows was a net TIC inflow of $69.9 billion. Of this, net foreign private inflows were $58.8 billion, and net foreign official inflows were $11.1 billion. |


