2018-08-01 09:30:00
U.S. ENERGY EFFICIENCY UP
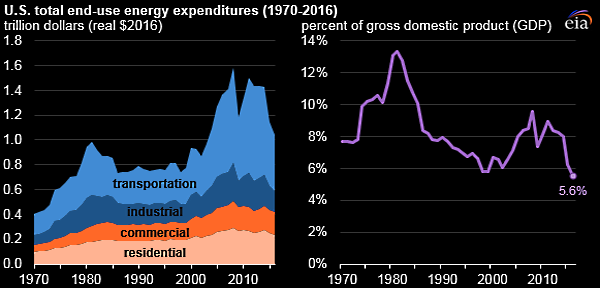
U.S. EIA - U.S. energy expenditures declined for the fifth consecutive year, reaching $1.0 trillion in 2016, a 9% decrease in real terms from 2015. Adjusted for inflation, total energy expenditures in 2016 were the lowest since 2003. Expressed as a percent of gross domestic product (GDP), total energy expenditures were 5.6% in 2016, the lowest since at least 1970.
Total U.S. GDP is calculated as the total value of goods and services produced in the United States including energy, and was $18.6 trillion in 2016, 1.5% (in real terms) higher than 2015 levels. U.S. GDP has grown every year since 2010, and U.S. total energy expenditures, which is the amount of money spent to consume energy in the United States, has decreased each year since 2011, leading to the record-low energy expenditure share.
The decrease in total U.S. energy expenditures in 2016 was entirely attributable to lower energy prices, as total energy consumption has remained virtually unchanged since 2013. The U.S. average energy price was $15.92 per million British thermal units (Btu) in 2016, down 9% from 2015, and the lowest since 2003, when adjusted for inflation. Average energy prices reached their highest point on record in 2008, when they averaged $24.13 per million Btu.
Based on realized prices in 2017 and some months in 2018, EIA does not expect the downward energy price trend to continue, as average energy prices of products such as motor gasoline, natural gas, and retail electricity have all increased since 2016, contributing to higher U.S. energy expenditures since that year.

The U.S. total energy price is calculated as the consumption-weighted average prices of all energy sources consumed in each of the four end-use sectors: transportation, industrial, residential, and commercial. The transportation and industrial sectors, the two largest end-use consuming sectors, account for most of the petroleum product consumption in the United States. For this reason, U.S. energy expenditures are heavily influenced by prices of petroleum products such as motor gasoline, distillate fuel oil, and hydrocarbon gas liquids. Expenditures on electricity, which were also relatively low in 2016, made up 74% of residential expenditures, 80% of commercial expenditures, and 37% of industrial expenditures.

At a state level, Louisiana had the highest energy expenditures per GDP of any state with 11.1% in 2016. Historically, Louisiana has had the highest energy expenditures per GDP of any state every year since 1997, the earliest year in EIA's data series on this topic. Louisiana's large industrial sector consumption, which includes its energy-intensive petrochemical industry, contributes to the state's relatively high ratio. Even while leading the nation, Louisiana saw a record-low ratio of energy expenditures per GDP that was less than half of the state's previous high (26.5%), reached in 2008.Overall, every state saw lower expenditures per GDP in 2016 compared to 2015, and 24 states and the District of Columbia reached their lowest ratio on record in 2016.
Mississippi (10.8%), Wyoming (10.5%), West Virginia (9.9%), and Alabama (9.4%) have the next highest state energy expenditures per GDP, which reflect a combination of relatively large state industrial sector consumption, including the energy-intensive coal mining industries in Wyoming and West Virginia, as well as relatively low GDP in each state. The District of Columbia (1.6%), New York (3.3%), Massachusetts (4.3%), California (4.3%), and Delaware (4.4%) have the lowest energy expenditures per GDP. This reflects relatively high consumption in less energy-intensive residential and commercial sectors as well as relatively high state GDP.
EIA's State Energy Data System (SEDS) contains a complete set of state-level estimates of energy production, consumption, prices, and expenditures through 2016.
-----
Earlier:

2018, July, 23, 13:25:00
GLOBAL ENERGY INVESTMENT DOWN 2%IEA - For the third consecutive year, global energy investment declined, to USD 1.8 trillion (United States dollars) in 2017 – a fall of 2% in real terms. The power generation sector accounted for most of this decline, due to fewer additions of coal, hydro and nuclear power capacity, which more than offset increased investment in solar photovoltaics. |

2018, July, 6, 11:15:00
U.S. ELECTRICITY INVESTMENTWSJ - A California utility is seeking permission to have a company build the world’s largest battery, joining a growing list of power companies investing in storing electricity. Pacific Gas & Electric Co., part of PG&E Corp. , detailed plans for four storage projects totaling nearly 570 megawatts in a Friday filing to regulators, including a 300-megawatt battery installation at a natural-gas-fired power plant owned by Vistra Energy Corp. |

2018, June, 15, 11:10:00
BP: GROWTH IN ENERGY DEMAND UPBP - In 2017 global energy demand grew by 2.2%, above its 10-year average of 1.7%. This above-trend growth was driven by stronger economic growth in the developed world and a slight slowing in the pace of improvement in energy intensity. |

2018, May, 23, 10:10:00
CLEAN NUCLEAR FUTUREWNN - The United States, Canada, and Japan are launching the Nuclear Innovation: Clean Energy (NICE) Future Initiative. This global effort will make sure nuclear has a seat at the table during discussions about innovation and advanced clean energy systems of the future. |

2018, May, 7, 08:10:00
U.S. LONG-DURATION ENERGY STORAGEU.S. DOE - Energy storage will play an increasingly critical role in the resilient grid of the future. Storage systems provide important services, including improving grid stability, providing backup power, and allowing for greater integration of renewable resources. Today’s dominant storage options have limitations that inhibit their use as long-duration solutions, particularly their high cost. |

2017, November, 9, 14:00:00
OPEC: 2040 GLOBAL ENERGY CHANGESWithin the grouping of Developing countries, India and China are the two nations with the largest additional energy demand over the forecast period, both in the range of 22–23 mboe/d.
|

2017, September, 8, 09:00:00
U.S. ENERGY INVESTMENT: $1.3 TLN“We welcome the President’s commitment to pro-growth tax reform, and look forward to working with the administration and Congress on continuing our nation’s energy leadership. Pro-growth tax reform and economic policies can further strengthen our energy infrastructure and benefit consumers. As an industry that invests billions in the U.S. economy each year, pro-growth policies would allow us to accelerate these economic investments while keeping energy affordable. Private investment in our nation’s energy infrastructure could exceed $1.3 trillion and support 1 million jobs annually through 2035.” |


