2018-09-26 09:25:00
U.S. OIL EXPORT RECORD
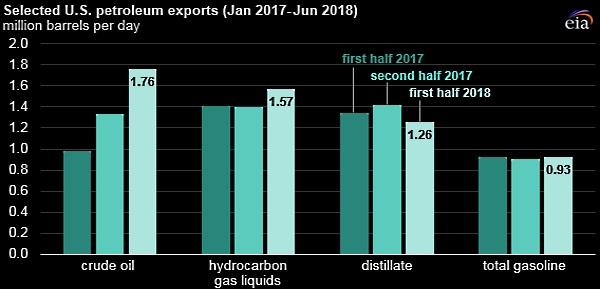
U.S. EIA - Crude oil surpassed hydrocarbon gas liquids (HGL) to become the largest U.S. petroleum export, with 1.8 million barrels per day (b/d) of exports in the first half of 2018. U.S. crude oil exports increased by 787,000 b/d, or almost 80%, from the first half of 2017 to the first half of 2018 and set a new monthly record of 2.2 million b/d in June. Much of this crude oil went to destinations in Asia and Oceania such as China, South Korea, and India. Europe was the second-largest market for U.S. crude oil exports, led by Italy, the United Kingdom, and the Netherlands. Canada was the only major U.S. crude oil export destination where exports decreased, down slightly in the first half of 2018 compared with the same period in 2017.

The United States exported 7.3 million barrels per day (b/d) of crude oil and petroleum products in the first half of 2018, the largest amount of crude oil and petroleum product exports ever for the first six months of a year. During this period, exports of crude oil and HGL set record monthly highs. U.S. exports of crude oil, HGLs, and motor gasoline grew in the first half of 2018 compared with the same period in 2017, while distillate exports decreased.
HGLs—including propane, ethane, butanes, and natural gasoline—were the second-largest petroleum export from the United States in the first half of 2018 at 1.6 million b/d. As with crude oil, destinations in Asia and Oceania such as Japan, South Korea, China, and India were also the primary recipients of U.S. HGLs. These countries have expanded petrochemical facilities that import U.S. HGLs as a feedstock. Overall U.S. HGL exports set a new monthly record at 1.7 million b/d in May.

In the first half of 2018, the United States exported 1.3 million b/d of distillate, primarily to destinations in Central and South America. The decline in U.S. distillate exports in the first half of 2018 compared with the first half of 2017 was mostly the result of lower exports to a number of destinations in Central and South America and in Europe. However, U.S. distillate exports are typically higher in the second half of the year. Compared with other petroleum exports, U.S. distillate exports go to the most destinations: 49 different destinations received at least 1,000 b/d of U.S. distillate in the first half of 2018.

The United States exported 913,000 b/d of motor gasoline in the first half of 2018, an increase of 144,000 b/d compared with the same period in 2017. More than half of U.S. motor gasoline exports went to Mexico in the first half of 2018, the largest to a single destination of any U.S. petroleum export. Mexico has relatively low refinery utilization rates and in recent years has increased imports of motor gasoline and other petroleum products from the United States. The 504,000 b/d of gasoline exported from the United States to Mexico in the first half of 2018 was equivalent to more than 60% of the gasoline consumed in Mexico in those months.

-----
Earlier:

2018, September, 24, 15:00:00
U.S. RIGS DOWN 2 TO 1,053BAKER HUGHES A GE - U.S. Rig Count is down 2 rigs from last week to 1,053, with oil rigs down 1 to 866, gas rigs unchanged at 186, and miscellaneous rigs down 1 to 1. Canada Rig Count is down 29 rigs from last week to 197, with oil rigs down 13 to 135 and gas rigs down 16 to 62. |

2018, September, 21, 10:30:00
U.S. CAPITAL EXPENDITURES UPU.S. EIA - Second-quarter 2018 financial results for 45 U.S. oil exploration and production companies that the U.S. Energy Information Administration (EIA) regularly tracks reveal that most companies increased their capital expenditure budgets for 2018 compared with initial budgets made at the beginning of the year. |

2018, September, 21, 10:25:00
U.S. ENERGY CASH: $119 BLNU.S. EIA - Energy companies’ free cash flow—the difference between cash from operations and capital expenditure—was $119 billion for the four quarters ending June 30, 2018, the largest four-quarter sum during 2013–18 Companies reduced debt for seven consecutive quarters, contributing to the lowest long-term debt-to-equity ratio since third-quarter 2014 |

2018, September, 19, 13:35:00
U.S. PRODUCTION: OIL + 79 TBD, GAS + 961 MCFDU.S. EIA - Crude oil production from the major US onshore regions is forecast to increase 79,000 b/d month-over-month in October from 7,515 to 7,594 thousand barrels/day , gas production to increase 961 million cubic feet/day from 72,127 to 73,088 million cubic feet/day . |

2018, September, 7, 12:45:00
U.S. PETROLEUM EXPORT RECORDU.S. EIA - The United States exported 7.3 million barrels per day (b/d) of crude oil and petroleum products in the first half of 2018, when exports of crude oil and hydrocarbon gas liquids (HGL) set record monthly highs. Crude oil surpassed HGLs to become the largest U.S. petroleum export, with 1.8 million b/d of exports in the first half of 2018. U.S. exports of crude oil, HGLs, and motor gasoline grew in the first half of 2018 compared with the same period in 2017, while distillate exports decreased 84,000 b/d |

2018, August, 20, 14:20:00
U.S. OIL PRODUCTION 10.7 MBDU.S. API - The American Petroleum Institute’s latest monthly statistical report shows the U.S. set a record for the production of natural gas liquids (NGL) last month producing 4.4 million barrels per day (mb/d). July also saw the U.S. tie its record for crude oil production at 10.7 mb/d. |

2018, August, 1, 09:30:00
U.S. ENERGY EFFICIENCY UPU.S. EIA - U.S. energy expenditures declined for the fifth consecutive year, reaching $1.0 trillion in 2016, a 9% decrease in real terms from 2015. Adjusted for inflation, total energy expenditures in 2016 were the lowest since 2003. Expressed as a percent of gross domestic product (GDP), total energy expenditures were 5.6% in 2016, the lowest since at least 1970. |


