2018-09-19 13:35:00
U.S. PRODUCTION: OIL + 79 TBD, GAS + 961 MCFD
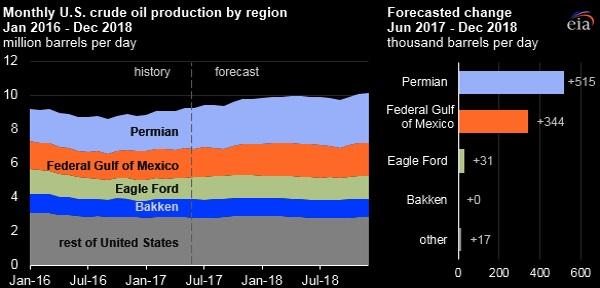
U.S. EIA - Crude oil production from the major US onshore regions is forecast to increase 79,000 b/d month-over-month in October from 7,515 to 7,594 thousand barrels/day , gas production to increase 961 million cubic feet/day from 72,127 to 73,088 million cubic feet/day .
| Oil production thousand barrels/day | Gas production million cubic feet/day | |||||
|---|---|---|---|---|---|---|
| Region | September 2018 | October 2018 | change | September 2018 | October 2018 | change |
| Anadarko | 554 | 562 | 8 | 7,220 | 7,318 | 98 |
| Appalachia | 126 | 130 | 4 | 29,143 | 29,441 | 298 |
| Bakken | 1,318 | 1,332 | 14 | 2,499 | 2,522 | 23 |
| Eagle Ford | 1,433 | 1,449 | 16 | 7,009 | 7,128 | 119 |
| Haynesville | 43 | 43 | - | 9,564 | 9,698 | 134 |
| Niobrara | 614 | 620 | 6 | 5,127 | 5,177 | 50 |
| Permian | 3,427 | 3,458 | 31 | 11,565 | 11,804 | 239 |
| Total | 7,515 | 7,594 | 79 | 72,127 | 73,088 | 961 |
| New-well oil production per rig barrels/day | New-well gas production per rig thousand cubic feet/day | |||||
|---|---|---|---|---|---|---|
| Region | September 2018 | October 2018 | change | September 2018 | October 2018 | change |
| Anadarko | 408 | 411 | 3 | 2,881 | 2,904 | 23 |
| Appalachia | 145 | 146 | 1 | 16,131 | 16,282 | 151 |
| Bakken | 1,491 | 1,501 | 10 | 1,871 | 1,908 | 37 |
| Eagle Ford | 1,446 | 1,448 | 2 | 5,736 | 5,862 | 126 |
| Haynesville | 25 | 26 | 1 | 8,681 | 8,748 | 67 |
| Niobrara | 1,189 | 1,190 | 1 | 4,458 | 4,474 | 16 |
| Permian | 555 | 546 | (9) | 1,225 | 1,225 | - |
| Total | 646 | 641 | (5) | 3,736 | 3,733 | (3) |
Drilled but uncompleted wells (DUC) |
|||
wells |
|||
Region |
July 2018 |
August 2018 |
change |
| Anadarko | 992 | 1,026 | 34 |
| Appalachia | 718 | 699 | -19 |
| Bakken | 755 | 751 | -4 |
| Eagle Ford | 1,517 | 1,545 | 28 |
| Haynesville | 183 | 191 | 8 |
| Niobrara | 447 | 427 | -20 |
| Permian | 3,419 | 3,63 | 211 |
| Total | 8,031 | 8,269 | 238 |
-----
Earlier:

2018, September, 17, 14:40:00
U.S. RIGS UP 7 TO 1,055BAKER HUGHES A GE - U.S. Rig Count is up 7 rigs from last week to 1,055, with oil rigs up 7 to 867, gas rigs unchanged at 186, and miscellaneous rigs unchanged at 2. Canada Rig Count is up 22 rigs from last week to 226, with oil rigs up 15 to 148 and gas rigs up 7 to 78. |

2018, August, 20, 14:20:00
U.S. OIL PRODUCTION 10.7 MBDU.S. API - The American Petroleum Institute’s latest monthly statistical report shows the U.S. set a record for the production of natural gas liquids (NGL) last month producing 4.4 million barrels per day (mb/d). July also saw the U.S. tie its record for crude oil production at 10.7 mb/d. |

2018, August, 13, 13:25:00
U.S. RIGS UP 13 TO 1,057BAKER HUGHES A GE - U.S. Rig Count is up 13 rigs from last week to 1,057, with oil rigs up 10 to 869, gas rigs up 3 to 186, and miscellaneous rigs unchanged at 2. Canada Rig Count is down 14 rigs from last week to 209, with oil rigs down 12 to 140 and gas rigs down 2 to 69. |

2018, August, 6, 12:40:00
U.S. RIGS DOWN 4 TO 1,044BAKER HUGHES A GE - U.S. Rig Count is down 4 rigs from last week to 1,044, with oil rigs down 2 to 859, gas rigs down 3 to 183, and miscellaneous rigs up 1 to 2. Canada Rig Count is unchanged from last week at 223 rigs, with oil rigs down 2 to 152 and gas rigs up 2 to 71. |

2018, August, 1, 09:30:00
U.S. ENERGY EFFICIENCY UPU.S. EIA - U.S. energy expenditures declined for the fifth consecutive year, reaching $1.0 trillion in 2016, a 9% decrease in real terms from 2015. Adjusted for inflation, total energy expenditures in 2016 were the lowest since 2003. Expressed as a percent of gross domestic product (GDP), total energy expenditures were 5.6% in 2016, the lowest since at least 1970. |

2018, July, 30, 13:10:00
U.S. RIGS UP 2 TO 1,048BAKER HUGHES A GE - U.S. Rig Count is up 2 rigs from last week to 1,048, with oil up 3 to 861, gas rigs down 1 to 186, and miscellaneous rigs unchanged at 1. Canada Rig Count is up 12 rigs from last week to 223, with oil rigs up 12 to 154 and gas rigs unchanged at 69. |

2018, July, 27, 12:50:00
U.S. OIL INVESTMENT UP, DEBT DOWNEIA - Capital expenditures for these 46 companies totaled almost $19 billion in the first quarter of 2018, a year-over-year increase of nearly $2 billion (10%). Most of these companies have announced that they expect to increase full-year 2018 capital expenditures from 2017 levels. |


