2019-01-16 11:10:00


OIL PRICES 2019-20: $61-65
U.S. EIA - SHORT-TERM ENERGY OUTLOOK
Forecast Highlights
EIA forecasts Brent prices will average $61 per barrel (b) in 2019 and $65/b in 2020. In 2018, Brent prices averaged $71/b. EIA expects West Texas Intermediate (WTI) crude oil prices will average $8/b lower than Brent prices in the first quarter of 2019 before the discount gradually falls to $4/b in the fourth quarter of 2019 and throughout 2020. EIA's forecast for the average WTI price for December 2019 of $59/b should be considered in the context of NYMEX futures and option contract values for December 2019 delivery. NYMEX trading during the five-day period ending January 10, 2019, suggest that a range of $28/b to $101/b encompasses the market expectation for December 2019 WTI prices at the 95% confidence level.
EIA estimates that U.S. crude oil production averaged 10.9 million b/d in 2018, up 1.6 million b/d from 2017, reaching its highest level and seeing its largest volume growth on record. EIA forecasts U.S. crude oil production to average 12.1 million b/d in 2019 and 12.9 million b/d in 2020, with most of the growth coming from the Permian region of Texas and New Mexico.
U.S. crude oil and petroleum product net imports are estimated to have fallen from an average of 3.8 million b/d in 2017 to an average of 2.4 million b/d in 2018. EIA estimates that the United States briefly was a net exporter of crude oil and petroleum products in November 2018. EIA forecasts that net imports will continue to fall to an average of 1.1 million b/d in 2019, and to less than 0.1 million b/d in 2020. In the fourth quarter of 2020, EIA forecasts the United States will be a net exporter of crude oil and petroleum products, by about 0.9 million b/d.
Global liquid fuels end-of-year inventories grew by an estimated 0.4 million b/d in 2018 and EIA expects they will grow by 0.2 million b/d in 2019 and by 0.4 million b/d in 2020.
U.S. dry natural gas production averaged a record high 83.3 billion cubic feet per day (Bcf/d) in 2018. EIA forecasts dry natural gas production will average 90.2 Bcf/d in 2019 and 92.2 Bcf/d in 2020. Increases in the Appalachia and Permian regions drive the forecast growth.
EIA forecasts that Henry Hub natural gas spot prices will average $2.89 per million British thermal units (MMBtu) in 2019 and $2.92/MMBtu in 2020, down from $3.15/MMBtu in 2018. EIA's forecast for the average Henry Hub price for December 2019 of $3.25/MMBtu should be considered in the context of NYMEX futures and option contract values for December 2019 delivery. NYMEX trading during the five-day period ending January 10, 2019, suggest that a range of $1.85/MMBtu to $4.80/MMBtu encompasses the market expectation for Henry Hub prices in December 2019 at the 95% confidence level.
EIA forecasts that U.S. coal production will total 729 million short tons (MMst) in 2019, down by 25 MMst (3%) from 2018. Coal production will further decline by 50 MMst (7%) in 2020. This decrease is the result of coal's relatively weak competiveness in the electric power sector compared with natural gas, as well as an assumption of lower demand for U.S. coal exports.
EIA expects the share of U.S. total utility-scale electricity generation from natural gas-fired power plants to rise from 35% in 2018 to 37% in 2020. Coal's forecast share of electricity generation falls from 28% in 2018 to 24% in 2020. The nuclear share of generation was 19% in 2018 and EIA forecasts that it will be about the same share in 2020. Nonhydropower renewables provided 10% of generation in 2018 and are expected to provide 13% in 2020. Hydropower's share of generation was 7% in 2018 and is forecast to be similar in 2019 and in 2020. In 2019, EIA expects wind's annual share of generation will exceed hydropower's share for the first time.
After increasing by 2.8% in 2018, EIA forecasts that energy-related carbon dioxide (CO2) emissions will fall by 1.2% in 2019 and by 0.8% in 2020. The declines reflect a forecast of more typical weather compared with 2018 and shifts in fuel use. Energy-related CO2 emissions are sensitive to changes in weather, economic growth, energy prices, and fuel mix.
Prices
Crude Oil Prices.
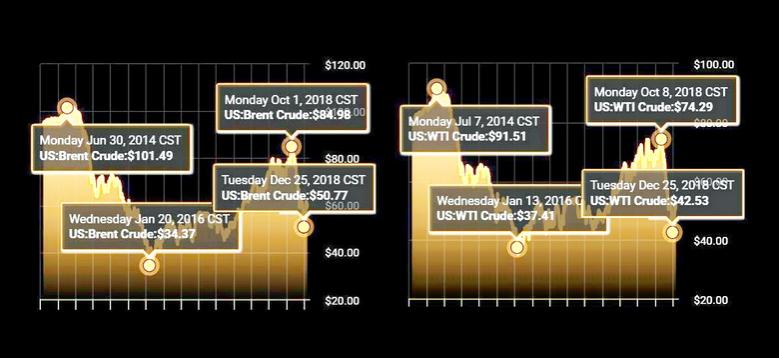
The spot price of Brent crude oil averaged $57/b in December, down from an average of $81/b in October 2018, which was the highest level since October 2014. The price decline in late 2018 largely reflected rising oil inventories as a result of record levels of crude oil production from the United States, Russia, and Saudi Arabia. Prices also fell as a result of uncertainties about global economic indicators and future oil demand growth.
Although OPEC+ producers announced in early December plans to cut production starting in January 2019, Brent crude oil prices continued to fall after the announcement. The price declines possibly reflected market expectations that announced production decreases would not be enough to offset increasing production levels in North America, along with the potential for weakening global oil demand growth, which could lead to continued growth in global oil inventory levels.

EIA estimates that global petroleum and other liquid fuels inventories rose by an average of 0.4 million b/d in 2018 and by an estimated 1.0 million b/d in the fourth quarter of 2018. EIA expects strong growth in U.S. and other non-OPEC liquid fuels production will contribute to global oil inventory growth of 0.2 million b/d in 2019 and 0.4 million b/d in 2020. However, EIA expects some of these inventories to be unavailable to the market because they will be the result of Iran increasing floating storage of crude oil that it cannot sell as a result of U.S. sanctions.
Given the expectation of relatively balanced markets in 2019 and 2020, with modest inventory builds, EIA forecasts Brent crude oil prices will remain lower than levels experienced during most of 2018, averaging $61/b in 2019 and $65/b in 2020. Although prices are forecast to remain lower than those experienced during most of 2018, some upward price movements from December 2018 price levels are expected to emerge in early 2019 from the need for global oil inventories to rise slightly to keep pace with demand growth and maintain five-year average levels of demand cover. Additional upward price moves are forecast in late 2019 and early 2020 because of an increase in refinery demand for light-sweet crude oil as a result of IMO regulations.
Daily and monthly average crude oil prices could vary significantly from annual average forecasts because global economic developments and geopolitical events in the coming months have the potential to push oil prices higher or lower than the current STEO price forecast. Uncertainty remains regarding how much oil the U.S. sanctions on Iran will take off the market following the expiration of waivers in the first half of 2019. In addition, questions remain regarding the duration of, and adherence to, the current OPEC+ production cuts. Developments regarding the rate of economic growth and its effect on global oil demand growth further contribute to price uncertainty. Also, although EIA expects crude oil price impacts from IMO regulations starting in 2020 to be limited, there remain many unknowns about how the global refining and shipping industries will respond, and actual outcomes of these decisions will affect crude oil prices. Finally, the U.S. tight oil sector continues to be dynamic, and quickly evolving trends in this sector could affect both current crude oil prices and expectations for future prices.
After averaging more than $10/b during October 2018, the discount of West Texas Intermediate (WTI) crude oil prices to Brent fell to an average of $8/b in December. Average WTI crude oil prices are forecast to be $6/b lower than Brent prices in 2019 and $4/b lower than Brent prices in 2020. The price discount of WTI to Brent in the forecast is based on the assumption that increasing crude oil production in the Permian Basin and current constraints on the capacity to transport crude oil from production areas in West Texas and from Cushing, Oklahoma, to refineries and export terminals along the U.S. Gulf Coast will persist until mid-2019. At that point, EIA expects that new takeaway capacity will come online from West Texas to the Gulf Coast that will reduce current distribution bottlenecks throughout Texas and Oklahoma.
The current values of futures and options contracts suggest significant uncertainty in the oil price outlook. WTI futures contracts for April 2019 delivery that were traded during the five-day period ending January 10 averaged $51/b, and implied volatility averaged 44%. These levels established the lower and upper limits of the 95% confidence interval for the market's expectations of monthly average WTI prices in April 2019 at $36/b and $73/b, respectively. The 95% confidence interval for market expectations widens over time, with lower and upper limits of $28/b and $101/b, respectively, for prices in December 2019.
Natural Gas Prices.
Henry Hub spot prices averaged $3.15 per million British thermal units (MMBtu) in 2018, up 16 cents/MMBtu from 2017 levels. EIA forecasts that Henry Hub natural gas spot prices will average $2.89/MMBtu in 2019 and $2.92/MMBtu in 2020. Forecast prices are lower than 2018 levels as expected production growth keeps pace with demand and export growth and inventories build faster than the five-year average. Natural gas futures contracts for April 2019 delivery that were traded during the five-day period ending January 10 averaged $2.69/MMBtu. Current options and futures prices indicate that market participants place the lower and upper bounds for the 95% confidence interval for April 2019 contracts at $2.06/MMBtu and $3.53/MMBtu, respectively. Last year at this time, the natural gas futures contracts for April 2018 delivery averaged $2.75/MMBtu, and the corresponding lower and upper limits of the 95% confidence interval were $2.01/MMBtu and $3.75/MMBtu, respectively.


Coal Prices.
EIA estimates the delivered coal price to U.S. electricity generators averaged $2.07 per million British thermal units (MMBtu) in 2018, which was 1 cent/MMBtu higher than the 2017 price. EIA forecasts that coal prices will be close to the same in 2019 and in 2020.
Global liquid fuels
EIA estimates that global petroleum and other liquid fuels inventories increased by 1.0 million barrels per day (b/d) in the fourth quarter of 2018, contributing to downward pressure on oil prices. EIA forecasts global liquid fuels balances will continue to build in the first half of 2019 at a pace of 0.3 million b/d, before oil markets become more balanced during the second half of 2019. EIA expects inventory builds to average 0.2 million b/d in 2019 and 0.4 million b/d in 2020. The higher builds in 2020 occur as U.S. production continues to grow and the 2019 forecast declines in Organization of the Petroleum Exporting Countries (OPEC) moderate.

EIA forecasts global liquid fuels production to average 101.8 million b/d in 2019 and consumption to average 101.5 million b/d, which contributes to modest inventory builds. Production growth in 2019 is led by non-OPEC countries, particularly the United States and Brazil. EIA expects non-OPEC producers will increase oil supply by 2.4 million b/d in 2019, which will offset forecast supply declines of 1.0 million b/d from OPEC members. In 2020, the main drivers of oil production growth are expected to be the United States, Canada, Brazil, and Russia, while OPEC crude oil production is expected to remain flat.
Brent crude oil spot prices averaged $71 per barrel (b) in 2018, an increase of $17/b from 2017 levels. Daily Brent spot prices last year reached a peak of $86/b in October 2018, which was the highest level since October 2014, before falling to nearly $50/b by the end of the year. The price decrease in the latter part of 2018 reflected global oil inventory builds and record levels of oil production from the world's three largest producers—the United States, Russia, and Saudi Arabia—along with uncertainties about global demand growth for the coming year. EIA forecasts that Brent spot prices will gradually increase from an average of $57/b in December 2018 to $65/b by December 2020. Forecast Brent spot prices average $61/b in 2019 and $65/b in 2020.
Global Petroleum and Other Liquid Fuels Consumption.
Global consumption of petroleum and other liquid fuels grew by 1.4 million b/d in 2018, reaching an average of 100.0 million b/d for the year. EIA expects consumption growth to average slightly above 1.5 million b/d in 2019 and in 2020. The relatively stable consumption growth reflects small forecast declines in the rate of global gross domestic product (GDP) growth from 2018, which EIA expects will be generally offset by lower oil prices in 2019 and 2020 compared with 2018, along with increases in petrochemical related demand and IMO-related volume gain.

Non-OECD countries continue to drive demand growth in the forecast. Non-OECD liquid fuels consumption growth accounts for 1.1 million b/d of the global growth in 2019 and 1.2 million b/d in 2020, with China and India accounting for most of this growth. EIA forecasts that China's consumption will increase by 0.5 million b/d in 2019 and in 2020. EIA does not expect growth in Chinese oil consumption to slow by as much as slowing GDP growth because of the addition of a number of petrochemical plants, which will add an estimated 75,000 b/d of consumption in 2019 and an additional 70,000 b/d in 2020. EIA's forecast liquid fuels consumption in India grows by more than 0.2 million b/d in both 2019 and 2020, driven by rising use of gasoline, jet fuel, and hydrocarbon gas liquids.

OECD petroleum and other liquid fuels consumption is forecast by EIA to grow by 0.4 million b/d in 2019 and by 0.3 million b/d in 2020. The United States is the leading contributor to this forecast growth, with consumption rising by 0.3 million b/d in 2019 and by 0.2 million b/d in 2020. EIA forecasts that Europe's liquid fuels consumption will grow by 90,000 b/d in 2019 and in 2020. Japan is expected to see liquid fuels consumption decline by an average of 80,000 b/d in both years.
Non‐OPEC Petroleum and Other Liquid Fuels Supply.
EIA estimates that non-OPEC petroleum and other liquid fuels supply increased by 2.5 million b/d in 2018. Production growth of 2.2 million b/d in the United States accounted for most of the 2018 supply growth, with Canada, Russia, Kazakhstan, and Brazil collectively adding an additional 0.6 million b/d. EIA expects non-OPEC petroleum and other liquid fuels production to rise by 2.4 million b/d in 2019 and by 1.9 million b/d in 2020. Forecast growth in the United States contributes 1.7 million b/d and 1.2 million b/d, respectively, in each year, with Brazil providing another 0.3 million b/d in 2019 and 0.2 million b/d in 2020.

EIA expects Canada's total liquid fuels production to decrease by 0.1 million b/d in 2019 as a result of government-mandated production cuts in Alberta. In 2020, EIA expects Canadian production to increase by 0.2 million b/d after the cuts end in late 2019. Oil sands projects, including Horizon, Fort Hills, and Hebron, continue to drive production growth in the forecast. EIA does not expect any additional production from new upstream projects to come online during the forecast period, only expansions of existing projects.
EIA expects Brazil's petroleum and other liquid fuels production to grow by more than 0.3 million b/d in 2019 and by 0.2 million b/d in 2020. The main driver of growth in 2018 was the addition of four floating, production, storage, and offloading vessels (FPSOs). Similarly, the addition of at least five more FPSOs will continue to drive growth through 2020. Continued emphasis on the development of pre-salt resources and implementation of previous reforms, including those to local content rules, could result in higher production growth during the forecast period. EIA believes the Santos Basin, particularly the Lula field, will produce enough crude oil in the next two years to offset declines in Brazil's more mature onshore and offshore areas.
EIA expects that during the first several months of 2019, Russia will gradually reduce production from record high levels reached during the fourth quarter of 2018. The expected reductions are a result of the agreement that Russia and other non-OPEC countries reached with OPEC members in December 2018. EIA then expects production growth in Russia to resume in the second half of 2019 and continue into 2020.
Another source of growth for non-OPEC petroleum and other liquid fuels production in the forecast period is Kazakhstan, where EIA forecasts production to ramp up in 2019 to peak production levels at the Kashagan field. Norway's production is expected to be mostly flat in 2019 and then increase by 0.1 million b/d in 2020 when the Martin Linge field and a number of smaller fields are scheduled to come online. Phase 1 of the Johan Sverdrup field, scheduled to come online by the end of 2019, drives most of the production growth in 2020. At its peak, Phase 1 will produce 0.4 million b/d. Australia, Qatar, and the United Kingdom are also expected to increase liquid fuels production in the forecast. EIA forecasts the largest declines among non-OPEC producers to be in Mexico, Indonesia, and Egypt.
OPEC Petroleum and Other Liquid Fuels Supply.
At OPEC's meeting in June 2018, the group noted it had exceeded its previous targets for production cuts set in late 2016 and asked its members to keep reductions at targeted levels. As a result, OPEC crude oil production increased during the second half of 2018, contributing to rising global oil inventories and falling crude oil prices. In light of these market conditions, on December 7, 2018, OPEC producers and non-OPEC participants (OPEC+) announced a 1.2 million b/d cut relative to October 2018 production levels that would begin in January 2019.
EIA's production forecast does not assume full compliance with the December 2018 cuts, although EIA expects the level of production cuts will contribute to the global markets returning to more balanced conditions during the second half of 2019. EIA expects that OPEC crude oil output will decrease by 1.0 million b/d on average in 2019 and will remain flat in 2020.
Qatar left OPEC effective on January 1, 2019. Starting with this edition of STEO, Qatar's crude oil and other liquid fuels production will be included in the non-OPEC data for both history and forecast. In 2018, EIA estimates that Qatar's crude oil production averaged about 610,000 b/d, with an additional 1.3 million b/d in non-crude liquids production.
Iraq is one of the main sources of production growth among OPEC members in the extended forecast period. EIA expects increasing production capacity at the northern Kirkuk fields and a resumption of Baghdad-administered exports through the Iraqi-Kurdistan pipeline will help alleviate export capacity issues and contribute to production growth. In addition, returning capacity at domestic refineries will increase domestic crude oil demand.
After the May 2018 announcement of the U.S. withdrawal from the Joint Comprehensive Plan of Action (JCPOA) and reinstatement of sanctions on Iran in November 2018, EIA estimates that Iranian crude oil and condensate production decreased significantly. By December 2018, Iranian crude oil production had declined by more than 1.0 million b/d from first quarter of 2018. Domestic Iranian consumption grew concurrently, as refineries increased output rates and power plants switched from natural gas to crude oil for electric power generation. For this reason, Iran's exports have fallen at a faster rate than production.
EIA assumes that U.S. sanctions on Iranian oil exports will remain in place through the end of the forecast period. Furthermore, the current forecast reflects an expectation that reduction exemption waivers issued to eight countries to continue buying Iranian oil will not be extended past May 2019.
Following reinstated sanctions on Iran and decreasing production in Venezuela, Saudi Arabia significantly increased production in the latter half of 2018, producing almost 0.8 million b/d more in November 2018 than in January 2018. On average, Saudi Arabia produced 10.4 million b/d in 2018, and EIA forecasts average Saudi production to fall below that level in 2019 and in 2020 as it complies with the latest OPEC+ production cut agreement.
As of December 2018, Venezuela's crude oil production stood at about 1.2 million b/d, near its lowest level since early 2003, when volumes fell as a result of a general strike. EIA expects Venezuela's production to continue to fall through the forecast period—albeit at a slower overall rate of decline—while the financial situation of the state-owned Petróleos de Venezuela (PdVSA) remains extremely precarious. Venezuela, which relies heavily on oil revenues, has seen its cash income severely constricted because only about half of its crude oil exports generate cash revenues. The rest is used for in-kind loan payments, which become less valuable with lower global oil prices. Venezuela's oil revenue is also reduced by ongoing payments to ConocoPhillips following an arbitration agreement about its seized assets and to holders of PdVSA's 2020 bonds.
In Africa, EIA expects production to increase in Angola and Nigeria through 2020. Angola's Kaombo field began production in 2018, with the second phase set to begin production in early 2019, and the Vandumbu field also came online in late 2018 ahead of schedule. Nigeria is expected to begin production at its offshore Egina project in early 2019. Libya saw production gains in 2018, albeit at marginal levels, as a result of production re-starts and development of new or previously shut-in wells. Although Libya's 2018 production level was the highest since 2012, supply disruptions will remain a significant risk during the forecast unless the security situation in the country improves.
OPEC non-crude oil liquids production averaged 5.3 million b/d in 2018 and EIA forecasts that it will remain roughly flat in 2019, and then decrease by 0.2 million b/d in 2020. The decrease in crude oil liquids next year is the result of lower expected condensate output in Iran.
OPEC unplanned crude oil supply disruptions averaged 2.2 million b/d in December 2018, an increase of 0.3 million b/d from November. The increase in outages mainly reflects new supply disruptions in Libya. In mid-December, Libya's National Oil Corporation issued a force majeure at El-Sharara after armed local militia attacked the oil field; the field remains occupied by local militia. Crude oil production in Nigeria has also been affected by issues related to its oil infrastructure. In mid-2018, both the Nembe Creek Trunk Line and the Trans-Forcados pipeline were shut down to repair leaks to its pipelines, which took about three months to complete.

EIA expects that OPEC surplus crude oil production capacity, which averaged 1.5 million b/d in 2018, will increase to 1.9 million b/d in 2019 and to 2.3 million b/d in 2020. This estimate does not include additional capacity that may be available in Iran but is offline because of U.S. sanctions on Iranian oil sales.

OECD Petroleum Inventories.
EIA estimates that OECD commercial crude oil and other liquid fuels inventories were 2.9 billion barrels at the end of 2018, equivalent to about 61 days of consumption. EIA expects OECD inventories to rise to just under 3.0 billion barrels at the end of 2019 and then rise to more than 3.0 billion barrels at the end of 2020.

Crude Oil Prices.
The spot price of Brent crude oil averaged $57/b in December, down from an average of $81/b in October 2018, which was the highest level since October 2014. The price decline in late 2018 largely reflected rising oil inventories as a result of record levels of crude oil production from the United States, Russia, and Saudi Arabia. Prices also fell as a result of uncertainties about global economic indicators and future oil demand growth.
Although OPEC+ producers announced in early December plans to cut production starting in January 2019, Brent crude oil prices continued to fall after the announcement. The price declines possibly reflected market expectations that announced production decreases would not be enough to offset increasing production levels in North America, along with the potential for weakening global oil demand growth, which could lead to continued growth in global oil inventory levels.
EIA estimates that global petroleum and other liquid fuels inventories rose by an average of 0.4 million b/d in 2018 and by an estimated 1.0 million b/d in the fourth quarter of 2018. EIA expects strong growth in U.S. and other non-OPEC liquid fuels production will contribute to global oil inventory growth of 0.2 million b/d in 2019 and 0.4 million b/d in 2020. However, EIA expects some of these inventories to be unavailable to the market because they will be the result of Iran increasing floating storage of crude oil that it cannot sell as a result of U.S. sanctions.
Given the expectation of relatively balanced markets in 2019 and 2020, with modest inventory builds, EIA forecasts Brent crude oil prices will remain lower than levels experienced during most of 2018, averaging $61/b in 2019 and $65/b in 2020. Although prices are forecast to remain lower than those experienced during most of 2018, some upward price movements from December 2018 price levels are expected to emerge in early 2019 from the need for global oil inventories to rise slightly to keep pace with demand growth and maintain five-year average levels of demand cover. Additional upward price moves are forecast in late 2019 and early 2020 because of an increase in refinery demand for light-sweet crude oil as a result of IMO regulations.
Daily and monthly average crude oil prices could vary significantly from annual average forecasts because global economic developments and geopolitical events in the coming months have the potential to push oil prices higher or lower than the current STEO price forecast. Uncertainty remains regarding how much oil the U.S. sanctions on Iran will take off the market following the expiration of waivers in the first half of 2019. In addition, questions remain regarding the duration of, and adherence to, the current OPEC+ production cuts. Developments regarding the rate of economic growth and its effect on global oil demand growth further contribute to price uncertainty. Also, although EIA expects crude oil price impacts from IMO regulations starting in 2020 to be limited, there remain many unknowns about how the global refining and shipping industries will respond, and actual outcomes of these decisions will affect crude oil prices. Finally, the U.S. tight oil sector continues to be dynamic, and quickly evolving trends in this sector could affect both current crude oil prices and expectations for future prices.
After averaging more than $10/b during October 2018, the discount of West Texas Intermediate (WTI) crude oil prices to Brent fell to an average of $8/b in December. Average WTI crude oil prices are forecast to be $6/b lower than Brent prices in 2019 and $4/b lower than Brent prices in 2020. The price discount of WTI to Brent in the forecast is based on the assumption that increasing crude oil production in the Permian Basin and current constraints on the capacity to transport crude oil from production areas in West Texas and from Cushing, Oklahoma, to refineries and export terminals along the U.S. Gulf Coast will persist until mid-2019. At that point, EIA expects that new takeaway capacity will come online from West Texas to the Gulf Coast that will reduce current distribution bottlenecks throughout Texas and Oklahoma.
The current values of futures and options contracts suggest significant uncertainty in the oil price outlook. WTI futures contracts for April 2019 delivery that were traded during the five-day period ending January 10 averaged $51/b, and implied volatility averaged 44%. These levels established the lower and upper limits of the 95% confidence interval for the market's expectations of monthly average WTI prices in April 2019 at $36/b and $73/b, respectively. The 95% confidence interval for market expectations widens over time, with lower and upper limits of $28/b and $101/b, respectively, for prices in December 2019.
Natural Gas
Natural Gas Consumption
Total U.S. natural gas consumption averaged an estimated 81.6 billion cubic feet per day (Bcf/d) in 2018, and EIA expects it to increase by 1.1 Bcf/d (1.3%) in 2019 and then increase by a further 0.9 Bcf/d (1.1%) in 2020.
The largest natural gas consuming sector in the United States is the electric power sector. EIA estimates that electric generation consumed an average of 29.0 Bcf/d in 2018, up 14.4% from 2017 because of warm summer temperatures in 2018 and the addition of natural gas-fired electric generation capacity. EIA forecasts power sector consumption of natural gas to remain largely unchanged in 2019 and then rise by 3.3% in 2020 because of continuing increases in natural gas-fired electric generation capacity.

In 2019, EIA expects residential and commercial natural gas consumption to average 13.4 Bcf/d and 9.3 Bcf/d, respectively, which are similar to consumption levels in 2018. Based on forecasts by the National Oceanic and Atmospheric Administration (NOAA), EIA forecasts 2019 heating degree days (HDD) to be 1% lower compared with 2018. The cold weather in the first quarter of 2018 raised natural gas consumption higher than seasonal norms in the residential and commercial sectors in the Northeast. Natural gas consumption in the residential and commercial sectors is expected to decline by 2.2% and by 3.2%, respectively, in 2020. The forecast decline in 2020 reflects NOAA's outlook for 1% fewer HDDs in 2020 compared with 2019.
EIA forecasts U.S. industrial sector consumption of natural gas to rise by 2.0% in 2019 and by 0.9% in 2020. Most of the increase in the forecast is attributable to new chemical projects. Low natural gas prices in recent years have made it economical to increase the use of natural gas as feedstock in ammonia for nitrogenous fertilizer and methanol manufacturers. According to S&P Platts, three methanol plants are currently under construction with in-service dates in 2019 and in 2020. The combined capacity of the three plants is almost 3.3 million metric tons per year, a 45% increase from the current U.S. capacity. Big Lake 1 in Louisiana and Liberty One 1 in West Virginia are expected to enter service in 2019. The Big Lake facility will convert dry natural gas into methanol, then to conventional gasoline. Liberty One 1 is a facility relocation from Rio De Janeiro, Brazil. Yuhuang's St. James 1 methanol plant is expected to enter service in mid-2020, and it would be the second-largest methanol facility in the United States, after the facility in Beaumont, Texas, which entered service in June 2018.
Natural Gas Production and Trade
EIA estimates that dry natural gas production will average 90.2 Bcf/d in 2019, an 8.3% increase from 2018 levels. In 2020, production is expected to increase by 2.2%, averaging 92.2 Bcf/d for the year. EIA's expected growth in natural gas production is largely in response to improved drilling efficiency and cost reductions, higher associated gas production from oil-directed rigs, and increased takeaway pipeline capacity from the highly productive Appalachia and Permian production regions. Forecast natural gas production growth is supported by planned expansions in liquefied natural gas (LNG) capacity and increased pipeline exports to Mexico.

The United States exported more natural gas than it imported in 2018, with net exports averaging 2.1 Bcf/d. Rising LNG exports and pipeline exports have contributed to a shift from the United States being a net importer of natural gas as recently as the first quarter of 2017. U.S. exports of natural gas, including exports to Mexico and Canada via pipeline and as LNG, averaged 10.0 Bcf/d in 2018. EIA forecasts that gross U.S exports will rise by 31.5% to 13.2 Bcf/d in 2019 and then by 15.1% to 15.2 Bcf/d in 2020.

EIA expects U.S. LNG exports to increase from an estimated 3.0 Bcf/d in 2018 to 5.1 Bcf/d in 2019 and to 6.8 Bcf/d in 2020, as three new liquefaction projects come online. EIA forecasts that U.S. LNG export capacity will almost double by the end of 2019 to 8.9 Bcf/d once new trains at Cameron LNG, Freeport LNG, and Elba Island LNG are commissioned, making U.S. LNG export capacity the third largest in the world behind Australia and Qatar. By mid-2020, EIA expects U.S. LNG export capacity to reach 9.6 Bcf/d once the third train at Freeport LNG comes online and to expand to 10.2 Bcf/d by mid-2020 once the third train at Corpus Christi LNG comes online.
U.S. natural gas exports to Mexico via pipeline have also increased as more infrastructure has been built to transport natural gas both to and within Mexico. U.S. pipeline exports to Mexico through October averaged 4.6 Bcf/d, increasing by 10% in 2018 compared with the same period in 2017. Exports to Mexico should to continue to increase as more natural gas-fired power plants come online in Mexico and more pipeline infrastructure within Mexico is built.
U.S. net natural gas pipeline imports from Canada decreased from 2017 to 2018. This decrease in net imports is expected to continue as Appalachian production growth displaces some Canadian natural gas imports in the U.S. Midwest markets.
Natural Gas Inventories.
As of January 4, 2019, U.S. working gas inventories were 2,614 Bcf, 7% lower than their year-ago level and 15% lower than the five-year (2014–18) average level. Based on an assumption of relatively normal temperatures in the first quarter of 2019, along with a forecast of growing natural gas production, EIA forecasts that inventories will be 1,405 Bcf at the end of March, which would be 15% lower than the five-year average for that time of year. EIA expects inventory injections to exceed the five-year average rate, as production outpaces consumption from the end of March through October, bringing inventories to a projected 3,758 Bcf at the end of October 2019, which would be slightly above the previous five-year average for the end of October and 16% more than at the end of October 2018.


Natural Gas Prices.
Henry Hub spot prices averaged $3.15 per million British thermal units (MMBtu) in 2018, up 16 cents/MMBtu from 2017 levels. EIA forecasts that Henry Hub natural gas spot prices will average $2.89/MMBtu in 2019 and $2.92/MMBtu in 2020. Forecast prices are lower than 2018 levels as expected production growth keeps pace with demand and export growth and inventories build faster than the five-year average. Natural gas futures contracts for April 2019 delivery that were traded during the five-day period ending January 10 averaged $2.69/MMBtu. Current options and futures prices indicate that market participants place the lower and upper bounds for the 95% confidence interval for April 2019 contracts at $2.06/MMBtu and $3.53/MMBtu, respectively. Last year at this time, the natural gas futures contracts for April 2018 delivery averaged $2.75/MMBtu, and the corresponding lower and upper limits of the 95% confidence interval were $2.01/MMBtu and $3.75/MMBtu, respectively.
Coal
Coal Supply.
EIA estimates that coal production declined by 20 million short tons (MMst) (3%) in 2018, despite a 19 MMst increase in U.S. coal exports. Appalachian region coal production, based largely on the strength of growth in coal exports, increased for the second year in a row, but Interior and Western region production declined by 5% and 3% in 2018, respectively. In both 2019 and in 2020, EIA expects total U.S. coal production to decline by 3% and 7%, respectively, because of anticipated declines in both exports and domestic consumption. The 2020 forecast production of 680 MMst would be the first time annual production totaled less than 700 MMst since 1978.


Coal Consumption
EIA estimates that coal consumption in the electric power sector for 2018 declined by 24 MMst (4%), despite a 4% increase in overall electricity generation. EIA expects power sector coal consumption to decline by 52 MMst (8%) in 2019 and by 44 MMst (7%) in 2020. The decrease in power sector consumption reflects increasing shares of electricity generation from both natural gas and renewable energy sources.

Coal Trade
The United States, with excess coal production and export terminal capacity, is a swing supplier of coal to the global market. When market conditions are favorable (high global coal prices, low shipping costs, disruptions in supply from other exporters, and/or increased demand from major consumers), U.S. coal exports often expand. However, exports often contract with a reversal of these market factors. EIA estimates that U.S. coal exports were 116 MMst in 2018, 20% higher than the amount exported in 2017, marking the fourth time on record that annual exports exceeded 110 MMst. EIA expects that some market conditions that favor U.S. coal exports will diminish and forecasts that coal exports will decline to 102 MMst in 2019 and to 94 MMst in 2020.
Despite EIA's overall forecast decline in U.S. coal exports, exports to Asia, particularly to India, Japan, and South Korea, are expected to remain strong. Exports to these three countries accounted for 33% (29 MMst) of the coal exported in 2018 through Septembercoal exported in 2018 through September. Coal exports to other countries/regions have also increased recently. U.S. coal exports to North Africa, particularly Egypt and Morocco, have risen, and they accounted for 7% of total exports in 2018 through September. Comparatively, coal exports to Canada and Mexico accounted for 9% of total exports during the same period.
Coal Prices.
EIA estimates the delivered coal price to U.S. electricity generators averaged $2.07 per million British thermal units (MMBtu) in 2018, which was 1 cent/MMBtu higher than the 2017 price. EIA forecasts that coal prices will be close to the same in 2019 and in 2020.
Electricity
Electricity Consumption.
EIA expects annual retail sales of electricity to the U.S. residential sector in 2019 to be 3.1% lower than residential sales in 2018, primarily as a result of milder expected summer temperatures this year. The National Oceanic and Atmospheric Administration (NOAA) projects that total U.S. cooling degree days (CDD) during 2019 will be 13% lower than in 2018. NOAA expects that U.S. heating degree days (HDD) will be slightly lower in 2019 than in 2018, contributing to the lower residential consumption forecast in 2019.

The milder expected summer weather in 2019 also affects the forecast for retail sales of electricity to the commercial sector, which is expected to decline by 0.7% this year. Reduced need for air conditioning in the commercial sector is partly offset by continued economic growth. EIA forecasts that industrial production by electricity-intensive industries will grow 3.7% in 2019 compared with 2.8% growth last year. This accelerated expansion contributes to EIA's forecast that retail sales of electricity to the industrial sector will grow by 0.9% in 2019.
NOAA forecast temperatures in 2020 are relatively close to the 10-year average, with 2020 HDDs falling slightly from 2019 and 2020 CDDs increasing slightly from 2019. EIA forecasts that residential and commercial electricity sales in 2020 will grow by 0.9% and 0.4%, respectively, as a result of an increasing number of retail customers and continued economic growth. Forecast industrial electricity sales fall by 0.3% in 2020 as growth in electricity-intensive industrial production slows.
Overall, EIA forecasts total electricity consumption to decline by 1.2% in 2019 from 2018 levels and then rise by 0.5% in 2020.
Electricity Generation.
EIA expects total U.S. electricity generation across all sectors to average 11.3 gigawatthours per day (GWh/d) in 2019, which would be 1.9% less than generation last year. From 1980 through 2005, U.S. electricity generation grew by an average of 2.3% per year. During the past decade, power generation has grown relatively little, fluctuating at an annual average of about 11.2 GWh/d since 2010 with year-to-year changes related to weather. EIA forecasts U.S. electricity generation will grow by 0.3% between 2019 and 2020.
The share of U.S. electricity generation supplied by natural gas-fired power plants has increased significantly during the past decade, rising from 24% of total generation in 2010 to an estimated 35% in 2018. This increase in the share of generation has been offset by reduced generation from coal-fired power plants. Coal supplied 45% of U.S. generation in 2010, compared with an estimated 28% in 2018. Much of this change in the mix of generation is a result of sustained low prices for natural gas, which have made that fuel competitive with coal.
EIA expects this trend in the U.S. generation mix to generally continue. EIA forecasts that the natural gas-fired share of generation will average 36% in 2019 and 37% in 2020. The forecast share of generation from coal-fired power plants averages 26% in 2019 and 24% in 2020. EIA expects the nuclear share of generation to average 19% in 2019 and then to fall slightly in 2020 in response to the planned retirement of generating units at the Pilgrim and Three Mile Island nuclear plants.

Renewables Generation and Capacity.
Renewable generation provided 17% of total electricity generation in 2018, and EIA expects the share of generation from renewable sources to increase in 2019 to 18% and to 20% in 2020. Within the renewables category, hydropower was 7% of total generation in 2018 and EIA forecasts that it will be about that share in 2019 and in 2020. The share of total generation for renewables other than hydropower, which was 10% in 2018, is forecast to rise to 11% in 2019 and to 13% in 2020.
EIA forecasts almost 5 gigawatts (GW) of utility-scale solar photovoltaic (PV) capacity will be added in 2019 and 6 GW will be added in 2020. Also, EIA expects nearly 9 GW of small-scale solar PV capacity to be installed during 2019–20, mostly in the residential sector.
Domestic PV markets are still adjusting from several factors. Tariffs on PV modules imported into the United States started at 30% in January 2018 and are expected to decline 5 percentage points annually as they phase out over four years and expire completely after 2021. In addition, revised PV installation targets in China produced a near-term surplus of PV modules that the international market is still rebalancing. The Internal Revenue Service published a safe harbor provision for PV installations to qualify for a 30% investment tax credit, which allows for a four-year construction period upon project initiation (considered to be the start of physical construction or the expenditure of 5% of project value).

EIA expects wind capacity to increase from 96 GW at the end of 2018 to 107 GW at the end of 2019 and to 114 GW by the end of 2020. Because wind capacity is often added at the end of the calendar year, increases in generation frequently lag increases in capacity for the year they occur and are reflected in the generation for the next year.
The build out of new wind capacity through 2020 is strongly affected by the phase out of the federal Production Tax Credit (PTC) for wind, which began with projects under construction starting after 2016. Such projects take several years to complete, and the last tranche of projects eligible for the full $25 per megawatthour tax credit will start to enter service in significant numbers in 2019. Activity will taper off in later years as projects started in 2016 approach the limit of their safe harbor provisions and as the construction pipeline begins to shrink, reflecting reduced PTC pay offs for projects beginning construction in 2017 and later.
More information is here.
-----
Earlier:

2019, January, 14, 11:45:00
OIL NEED INVESTMENTPLATTS - Oil prices averaging $70/b in 2018 underscore the need for more investment in new supply, UAE energy minister Suhail al-Mazrouei told delegates at the Atlantic Council's Global Energy Forum in Abu Dhabi on Saturday.
|

2019, January, 11, 11:40:00
FAST ENERGY GROWTHU.S. EIA - Energy consumption in Asia, the Middle East, and Africa continues to grow rapidly, with about 20% growth in each region between 2010 and 2016, according to newly available data in EIA’s International Energy Statistics database. In particular, energy consumption has been increasing in the Middle East and Africa, driven by economic growth, increased access to energy markets, and quickly growing populations. Energy consumption in Asia grew even as energy consumption in China declined between 2015 and 2016.
|

2019, January, 11, 11:20:00
U.S. CO2 EMISSIONS UPPOWERMAG - A new study from an economic research group shows that U.S. emissions of carbon dioxide (CO2) rose about 3.4% last year, including a 1.9% rise in emissions from power generation.
|

2018, December, 26, 07:35:00
MARKET WILL BE BALANCEDREUTERS - “I think that during the first half, due to joint efforts, which were confirmed by the OPEC and non-OPEC countries this December, the situation will be more stable, more balanced,” Novak said in an interview on Rossiya-24 TV. |

2018, December, 24, 12:00:00
U.S. PRIMARY ENERGY PRODUCTION 8.0 QUADRILLION BTUU.S. EIA - U.S. primary energy production totaled 8.0 quadrillion British thermal units (Btu), a 10% increase compared with September 2017.
|

2018, September, 26, 09:35:00
OPEC: GLOBAL ENERGY DEMAND WILL UP BY 33%OPEC - Total primary energy demand is expected to increase by 91 mboe/d between 2015 and 2040 to reach 365 mboe/d in 2040
|

2018, September, 24, 15:30:00
BALANCED OIL MARKETOPEC - The JMMC noted that, despite growing uncertainties surrounding market fundamentals, including the economy, demand and supply, the participating producing countries of the DoC continue to seek a balanced and sustainably stable global oil market, serving the interests of consumers, producers, the industry and the global economy at large. The Committee also expressed its satisfaction regarding the current oil market outlook, with an overall healthy balance between supply and demand. |


