2019-01-09 11:05:00


U.S. GAS UP
EIA - In 2018, the average annual Henry Hub natural gas spot price increased to $3.16 per million British thermal units (MMBtu), up 15 cents from the 2017 average. Prices increased gradually through much of the year, with significant price increases during October and November, before declining at the end of December. Growing U.S. production and low temperatures during the winter months supported increased natural gas consumption through 2018. In addition, continued increases of U.S. natural gas exports by pipeline to Mexico and additional liquefied natural gas (LNG) export capacity that came online during the year resulted in the United States exporting more natural gas than it imported for the second year in a row.

During January 2018, natural gas spot prices spiked in the Northeast as a period of prolonged cold weather affected much of the eastern United States. Spot prices at the Algonquin Citygate, which serves Boston-area consumers, and the Transco Zone 6 NY hub, which serves New York City, averaged $15.52/MMBtu and $17.67/MMBtu, respectively, in January. Daily prices reached as high as $125/MMBtu at Algonquin Citygate and $175/MMBtu at Transco Zone 6 NY on January 5. High demand for natural gas to provide space heating contributed to a record-high weekly withdrawal from U.S. storage, totaling 359 billion cubic feet (Bcf) for the week ending January 5.
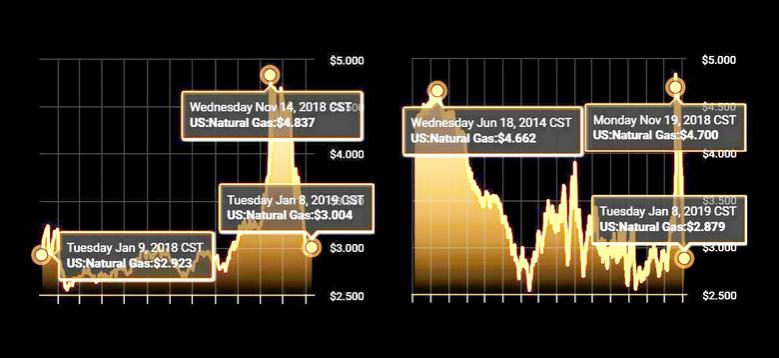
In November, natural gas prices again rose as many areas of the United States experienced colder-than-normal temperatures. Several weeks of inventory withdrawals in mid-November placed upward pressure on prices, which reached $4.70/MMBtu at the Henry Hub, or $1.65/MMBtu higher than on the same date in 2017. Prices fell at Henry Hub throughout the month of December, and as of January 2, 2019, prices were $2.79/MMBtu.

Several other regions in the Lower 48 states experienced natural gas price spikes in 2018. Daily average natural gas spot prices at the SoCal Citygate in Southern California experienced volatility throughout 2018 as ongoing pipeline capacity constraints limited natural gas supply in the region. In addition, a pipeline rupture on Enbridge's 2.9 Bcf/d BC Pipeline on October 9 in British Columbia limited U.S. imports from Canada, resulting in reduced supply to the Pacific Northwest and contributing to increased prices at the Northwest Sumas trading hub.
Since 2014, natural gas spot prices in Appalachia have traded at a discount to Henry Hub because pipeline capacity to flow natural gas to other regions has been limited. The spread in natural gas spot prices between the Henry Hub in Louisiana and the Appalachian region continued to narrow in 2018. Pipeline capacity buildout in the Appalachian region continued during 2018 to bring natural gas to demand centers outside the region, decreasing the price difference between the two regions.
When final data become available in the coming months, EIA expects that U.S. natural gas production will have reached record levels in 2018. Through the first ten months of 2018, dry natural gas production in the United States was 11% higher in 2018 compared with the same period in 2017. Growth has been driven by production increases in the Appalachian Basin in the Northeast, the Permian Basin in western Texas and New Mexico, and the Haynesville Shale in Texas and Louisiana.
Domestic consumption of natural gas also increased in 2018. This rise is largely driven by natural gas-fired plants replacing coal-fired plants in the electricity fuel mix, with consumption 17% higher than 2017 levels through the first ten months of the year. Increased industrial sector investment and the need for space heating and air conditioning contributed to annual growth in natural gas consumption across the industrial (5%), commercial (12%), and residential (16%) sectors during the same period.
Continued growth of U.S. LNG exports and U.S. pipeline exports to Mexico resulted in the United States exporting more natural gas than it imported for the second year in a row. Exports of natural gas to Mexico by pipeline exceeded 5 Bcf/d in July 2018 following expansions in cross-border pipeline capacity. Capacity additions at the Sabine Pass LNG export facility in Louisiana and the start of commercial operations at the Cove Point LNG facility in Maryland contributed to the expansion of LNG exports.

-----
Earlier:

2018, December, 21, 14:20:00
U.S. PRODUCTION: OIL + 134 TBD, GAS + 1,127 MCFDU.S. EIA - Crude oil production from the major US onshore regions is forecast to increase 134,000 b/d month-over-month in January from 8,032 to 8,166 thousand barrels/day , gas production to increase 1,127 million cubic feet/day from 75,789 to 76,916 million cubic feet/day .
|

2018, December, 12, 08:45:00
U.S. LNG WILL UPU.S. EIA - EIA projects that U.S. liquefied natural gas (LNG) export capacity will reach 8.9 billion cubic feet per day (Bcf/d) by the end of 2019, making it the third largest in the world behind Australia and Qatar. Currently, U.S. LNG export capacity stands at 3.6 Bcf/d, and it is expected to end the year at 4.9 Bcf/d as two new liquefaction units (called trains) become operational.
|

2018, December, 10, 08:40:00
U.S. GAS PRICES UP AGAINU.S. EIA - On November 23, the natural gas spot price at the Henry Hub in Louisiana was $4.70 per million British thermal units (MMBtu), the highest price since a temporary spike in January 2018, and before that, the highest price since June 2014.
|

2018, December, 3, 11:55:00
U.S. PRODUCTION: OIL +1.1%, GAS +1.8%U.S. EIA - Crude oil production increases 1.1% in September from 11,346 to 11,475 thousand barrels/day , gas production increases 1.8% from 102,659 to 104,461 million cubic feet/day .
|

2018, December, 3, 11:50:00
U.S. GAS PRODUCTION UP BY 13.8%U.S. EIA - In September 2018, for the 17th consecutive month, dry natural gas production increased year to year for the month. The preliminary level for dry natural gas production in September 2018 was 2,590 billion cubic feet (Bcf), or 86.3 Bcf/d. This level was 10.5 Bcf/d (13.8%) higher than the September 2017 level of 75.8 Bcf/d.
|

2018, November, 30, 11:40:00
U.S. OIL GAS RESERVES 2017U.S. EIA - Proved reserves of crude oil in the United States increased 19.5% (6.4 billion barrels) to 39.2 billion barrels at Year-End 2017, setting a new U.S. record for crude oil proved reserves. The previous record was 39.0 billion barrels set in 1970. Proved reserves of natural gas increased by 123.2 trillion cubic feet (Tcf) (36.1%) to 464.3 Tcf at year-end 2017—a new U.S. record for total natural gas proved reserves. The previous U.S. record was 388.8 Tcf, set in 2014. |

2018, November, 19, 11:25:00
U.S. GAS PRICES UPREUTERS - Next-day natural gas prices for Friday at the Sumas hub on the border between Washington state and British Columbia quadrupled to a record high on forecasts for cooler, near-normal weather in the Pacific Northwest and declining pipeline flows from Canada. |


