2019-10-09 13:20:00


OIL PRICES 2019-20: $59-$57
U.S. EIA - October 8, 2019 - SHORT-TERM ENERGY OUTLOOK
Forecast Highlights
Global liquid fuels
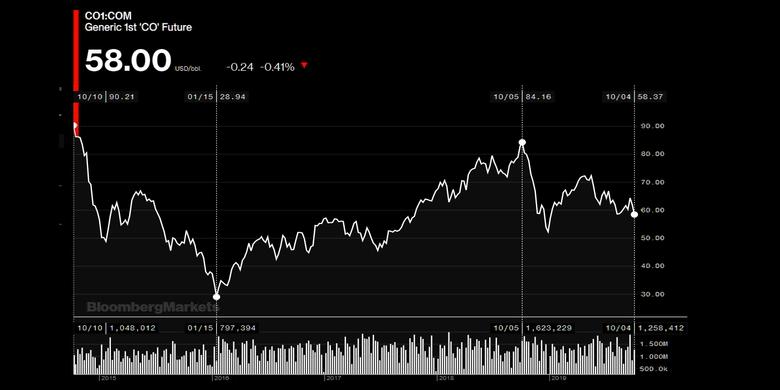
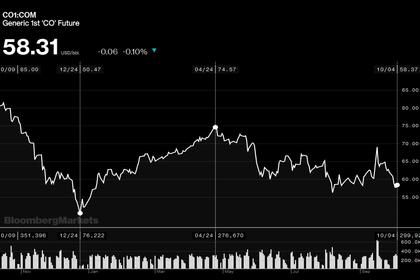
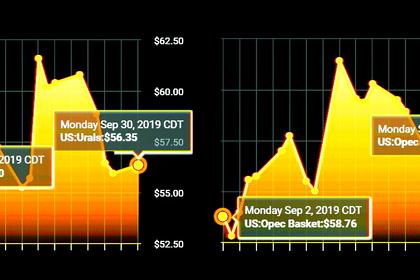
Brent crude oil spot prices averaged $63 per barrel (b) in September, up $4/b from August and down $16/b from the September 2018 average. Brent spot prices began September at $61/b and increased to $68/b after attacks on major Saudi Arabian oil infrastructure disrupted the country's crude oil production. However, Brent spot prices have subsequently fallen, reaching $58/b on October 4, as Saudi Arabia restored the shut-in production and concerns about oil demand based on the condition of the global economy rose.
EIA forecasts Brent spot prices will average $59/b in the fourth quarter of 2019 and then fall to $57/b by the second quarter of 2020, which is $5/b lower than forecast in the September STEO. Despite the recent increase in supply disruptions, EIA expects downward oil price pressure to emerge in the coming months as global oil inventories rise during the first half of 2020. EIA forecasts balances to tighten later in 2020 and expects Brent prices to rise to an average of $62/b in the second half of next year. The resulting forecast average price in 2020 is $60/b, $2/b lower than forecast in the September STEO. EIA's October forecast recognizes a higher level of oil supply disruption risk than previously assumed, more-than-offset by increasing uncertainty about economic and oil demand growth in the coming quarters, resulting in a lowered oil price forecast.
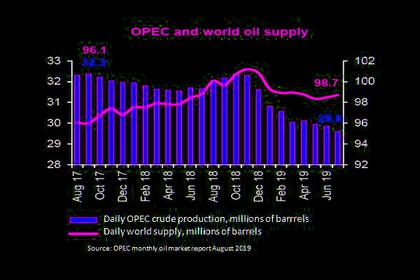
EIA estimates that crude oil production from the Organization of the Petroleum Exporting Countries (OPEC) averaged 28.2 million barrels per day (b/d) in September. Production was down 1.6 million b/d from August, the lowest level of OPEC production since November 2003—as a result of the disruptions in Saudi Arabia—and down 4.0 million b/d from September 2018. The decrease in OPEC crude oil production during the past year was primarily the result of falling production in Iran and Venezuela as well as the recent disruption in Saudi Arabia. However, EIA estimates that Saudi Arabia's crude oil production returned to pre-outage levels as of October 3. EIA forecasts that annual average OPEC crude oil production will average 29.8 million b/d in 2019, down by 2.1 million from 2018, and 29.6 million b/d in 2020.
EIA reported that U.S. crude oil production averaged 11.8 million b/d in July (the most recent month for which data are available), down 0.3 million b/d from June. Declining production was a result of Hurricane Barry, which disrupted crude oil production in the Gulf of Mexico. U.S. crude oil production remained relatively flat during the first seven months of 2019 because of disruptions to Gulf of Mexico platforms and slowing growth in tight oil production. The slowing rate of growth in tight oil production reflects relatively flat crude oil price levels and slowing growth in well-level productivity in the Lower 48 states. However, EIA expects growth to pick up in the fourth quarter as production returns in the Gulf of Mexico and pipelines in the Permian Basin come online to link production areas in West Texas and New Mexico to refining and export centers on the Gulf Coast. However, EIA forecasts growth to level off in 2020 because of falling crude oil prices in the first half of the year and continuing declines in well-level productivity. EIA forecasts U.S. crude oil production will average 12.3 million b/d in 2019, up 1.3 million from the 2018 level, and will rise by 0.9 million b/d in 2020 to an annual average of 13.2 million b/d.
Natural gas
The Henry Hub natural gas spot price averaged $2.56 per million British thermal units (MMBtu) in September, up 34 cents/MMBtu from August, which was the first monthly price increase since March. EIA forecasts Henry Hub prices to average $2.43/MMBtu in the fourth quarter of 2019, a decrease of more than $1/MMBtu from the fourth quarter of 2018, subsequently increasing to an average of $2.52/MMBtu in 2020. U.S. natural gas prices have fallen in 2019 because of strong supply growth that has enabled natural gas inventories to build more than average during the April through October injection season.
EIA forecasts that average annual U.S. dry natural gas production will average 91.6 billion cubic feet per day (Bcf/d) in 2019, up 10% from the 2018 average. EIA expects that natural gas production will grow much less in 2020 because the delayed effect of low prices in the second half of 2019 will reduce natural gas-directed drilling in 2020. EIA forecasts natural gas production in 2020 will average 93.5 Bcf/d.
Natural gas storage injections in the United States have outpaced the previous five-year (2014–18) average so far during the 2019 injection season as a result of rising natural gas production. At the beginning of April, the natural gas inventory injection season started with working inventories 28% below the five-year average for the same period. By the week ending September 27, working gas inventories reached 3,317 billion cubic feet (Bcf), within 1%, of the five-year average. EIA forecasts that natural gas storage levels will total 3,792 Bcf by the end of October, which is 2% above the five-year average and 17% above October 2018 levels.
Electricity, coal, renewables, and emissions
EIA expects the share of U.S. total utility-scale electricity generation from natural gas-fired power plants will rise from 34% in 2018 to 37% in 2019 and 2020. EIA forecasts that the share of U.S. electric generation from coal will average 25% in 2019 and 22% in 2020, down from 28% in 2018. EIA's forecast nuclear share of U.S. generation remains at about 20% in 2019 and in 2020. Hydropower averages a 7% share of total U.S. generation in the forecast for 2019 and 2020, similar to 2018. Wind, solar, and other nonhydropower renewables provided almost 10% of U.S. total utility-scale generation in 2018. EIA expects they will provide more than 10% in 2019 and 12% in 2020.
EIA expects total U.S. coal production to decrease to 159 million short tons (MMst) in the fourth quarter of 2019, a decline of 34 MMst (17%) from the same period in 2018. The resulting estimate of U.S. production totals 679 MMst in 2019, which would be a 76 MMst (10%) decline from the 2018 level. Declining coal demand and related bankruptcies, ownership changes, and sudden mine closures have contributed to a fluctuating production environment in the Western region (largely the Powder River Basin), which produces more than half of the U.S. coal supply. EIA expects coal production to decline further by 11% in 2020 to 603 MMSt.
EIA expects U.S. electric power sector generation from renewables other than hydropower—principally wind and solar—to grow from 414 billion kilowatthours (kWh) in 2019 to 471 billion kWh in 2020. In EIA's forecast, Texas accounts for 19% of the U.S. nonhydropower renewables generation in 2019 and 22% in 2020. California's forecast share is 15% in 2019 and 14% in 2020. The Midwest and Central power regions each see shares in the 16% to 17% range of the U.S. generation total from nonhydropower renewables in 2019 and 2020.
EIA forecasts that, after rising by 2.7% in 2018, U.S. energy-related carbon dioxide (CO2) emissions will decline by 2.4% in 2019 and by 1.7% in 2020, due in part to lower forecast consumption of energy. In 2019, EIA forecasts there will be lower demand for space cooling because of a forecast 6% decline in cooling degree days from 2018, when it was significantly higher than the previous 10-year (2008–17) average. In addition, EIA also expects U.S. CO2 emissions in 2019 to decline because the forecast share of electricity generated from natural gas and renewables will increase while the share generated from coal, which is a more carbon-intensive energy source, will decrease.
-----
Earlier:
2019, October, 7, 13:30:00
РЫНОК НЕФТИ СТАБИЛЕН
«Мы видим, что в этом году под воздействием различных факторов спрос на нефть будет ниже. Прирост к прошлому году составит 1-1,1 млн баррелей в сутки. В прошлом году прирост был полтора млн баррелей в сутки. Сильное влияние на снижение спроса оказывает состояние мировой экономики, которая замедляется. Ее рост, по оценкам экспертов, составит 3%, а может и менее, в то время как в прошлом году прирост мировой экономики составлял 3,6%», - сказал Министр энергетики Российской Федерации.
2019, October, 4, 10:40:00
OPEC, GECF COOPERATION
HE Mohammad Sanusi Barkindo, Secretary General of OPEC, and his GECF counterpart, HE Yury Sentyurin, signed the MoU in Moscow on the sidelines of Russian Energy Week.
2019, October, 4, 10:35:00
OPEC+: PREDICTABILITY, RELIABILITY
“What matters is supply predictability and reliability. We have a business-like approach with our energy partners in Europe and the rest of the world, of a commercial nature with no political reasoning,” Putin added.
2019, October, 4, 09:55:00
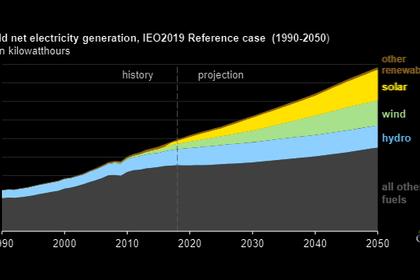
2050: RENEWABLES WILL BE HALF
EIA projects that renewables will collectively increase to 49% of global electricity generation by 2050. Of the top three renewable sources, EIA expects solar’s share of generation to grow the fastest and hydroelectric’s share to grow the slowest.
2019, October, 2, 12:20:00
ОПЕК + РОССИЯ: СТАБИЛИЗАЦИЯ
В настоящий момент, по словам главы Минэнерго России, на мировом нефтяном рынке складывается устойчивая ситуация, что отражается в стабильной цене на нефть в примерно $60 за баррель.
2019, October, 2, 11:45:00
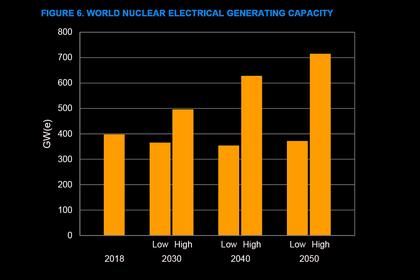
NUCLEAR POWER - 2050: UPDOWN
The new projections to 2030 see generating capacity declining by some 8% in the low case and increasing by 25% in the high estimate. By 2050, it’s seen falling by 6% in the low scenario and rising by 80% in the high case. Compared with last year, the new estimates to 2050 are down by 33 GW(e) in the high case and up by 15 GW(e) in the low case.

2019, September, 30, 15:10:00
ENERGY CHANGES CLIMATE
These three levers, each with their own potential to disrupt the market and offer new growth opportunities to the companies that leverage them, are often discussed in the energy industry: Digital technology, climate change, and dealing with risk


