2019-10-07 12:20:00


U.S. INTERNATIONAL TRADE DEFICIT UP TO $54.9 BLN
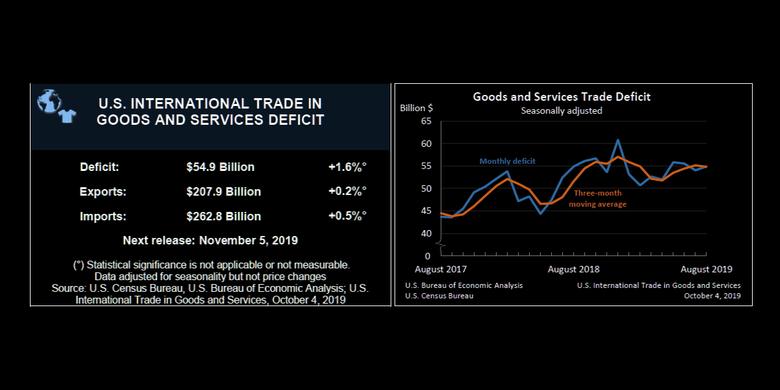
U.S. BEA - October 4, 2019 - The U.S. Census Bureau and the U.S. Bureau of Economic Analysis announced today that the goods and services deficit was $54.9 billion in August, up $0.9 billion from $54.0 billion in July, revised.
Exports, Imports, and Balance (exhibit 1)
August exports were $207.9 billion, $0.5 billion more than July exports. August imports were $262.8 billion, $1.3 billion more than July imports.
The August increase in the goods and services deficit reflected an increase in the goods deficit of $0.8 billion to $74.4 billion and a decrease in the services surplus of less than $0.1 billion to $19.5 billion.
Year-to-date, the goods and services deficit increased $28.3 billion, or 7.1 percent, from the same period in 2018. Exports decreased $3.2 billion or 0.2 percent. Imports increased $25.1 billion or 1.2 percent.
Three-Month Moving Averages (exhibit 2)
The average goods and services deficit decreased $0.3 billion to $54.8 billion for the three months ending in August.
- Average exports decreased $0.8 billion to $207.2 billion in August.
- Average imports decreased $1.1 billion to $262.0 billion in August.
Year-over-year, the average goods and services deficit increased $3.2 billion from the three months ending in August 2018.
- Average exports decreased $2.0 billion from August 2018.
- Average imports increased $1.2 billion from August 2018.
Exports (exhibits 3, 6, and 7)
Exports of goods increased $0.4 billion to $138.6 billion in August.
Exports of goods on a Census basis increased $0.4 billion.
- Industrial supplies and materials increased $1.5 billion.
- Fuel oil increased $0.8 billion.
- Nonmonetary gold increased $0.4 billion.
- Foods, feeds, and beverages increased $0.5 billion.
- Soybeans increased $0.3 billion.
- Capital goods decreased $1.4 billion.
- Civilian aircraft decreased $1.3 billion.
Net balance of payments adjustments decreased $0.1 billion.
Exports of services increased $0.1 billion to $69.3 billion in August.
- Financial services increased $0.1 billion.
- Other business services increased $0.1 billion.
- Transport decreased $0.1 billion.
Imports (exhibits 4, 6, and 8)
Imports of goods increased $1.2 billion to $213.0 billion in August.
Imports of goods on a Census basis increased $1.1 billion.
- Consumer goods increased $1.9 billion.
- Cell phones and other household goods increased $1.1 billion.
- Capital goods increased $1.9 billion.
- Semiconductors increased $0.8 billion.
- Other industrial machines increased $0.4 billion.
- Industrial supplies and materials decreased $1.5 billion.
- Other petroleum products decreased $0.7 billion.
- Crude oil decreased $0.5 billion.
Net balance of payments adjustments increased $0.1 billion.
Imports of services increased $0.1 billion to $49.8 billion in August.
- Insurance services increased $0.1 billion.
Real Goods in 2012 Dollars – Census Basis (exhibit 11)
The real goods deficit increased $0.3 billion to $85.7 billion in August.
- Real exports of goods increased $1.6 billion to $150.4 billion.
- Real imports of goods increased $1.9 billion to $236.1 billion.
Revisions
Revisions to July exports
- Exports of goods were revised up $0.1 billion.
- Exports of services were revised down $0.1 billion.
Revisions to July imports
- Imports of goods were revised down less than $0.1 billion.
- Imports of services were revised up $0.1 billion.
Goods by Selected Countries and Areas: Monthly – Census Basis (exhibit 19)
The August figures show surpluses, in billions of dollars, with South and Central America ($5.0), Hong Kong ($2.2), Brazil ($1.4), OPEC ($0.8), Singapore ($0.7), United Kingdom ($0.6), and Saudi Arabia ($0.3). Deficits were recorded, in billions of dollars, with China ($28.9), European Union ($15.6), Mexico ($8.4), Germany ($6.9), Japan ($6.1), Italy ($2.6), India ($2.4), Taiwan ($2.3), South Korea ($2.1), Canada ($1.6), and France ($1.5).
- The deficit with Germany increased $0.7 billion to $6.9 billion in August. Exports increased $0.2 billion to $4.9 billion and imports increased $0.8 billion to $11.8 billion.
- The deficit with South Korea increased $0.5 billion to $2.1 billion in August. Exports increased $0.1 billion to $4.8 billion and imports increased $0.7 billion to $6.9 billion.
- The deficit with Canada decreased $1.4 billion to $1.6 billion in August. Exports increased $0.6 billion to $24.8 billion and imports decreased $0.8 billion to $26.4 billion.
-----
Earlier:
2019, September, 27, 13:10:00
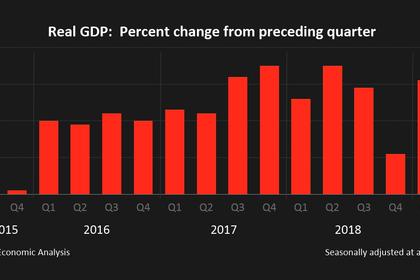
U.S. GDP UP 2.0%
Real gross domestic product (GDP) increased at an annual rate of 2.0 percent in the second quarter of 2019, according to the "third" estimate released by the Bureau of Economic Analysis. In the first quarter, real GDP increased 3.1 percent.
2019, September, 20, 15:10:00
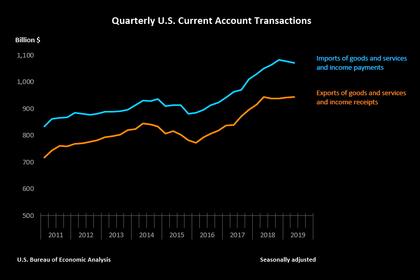
U.S. TRADE DEFICIT DOWN TO $128.2 BLN
The U.S. current account deficit, which reflects the combined balances on trade in goods and services and income flows between U.S. residents and residents of other countries, narrowed by $8.0 billion, or 5.9 percent, to $128.2 billion in the second quarter of 2019, according to statistics from the U.S. Bureau of Economic Analysis (BEA). The revised first quarter deficit was $136.2 billion.


