2019-10-25 09:30:00


U.S. PETROLEUM EXPORTS 5.47 MBD
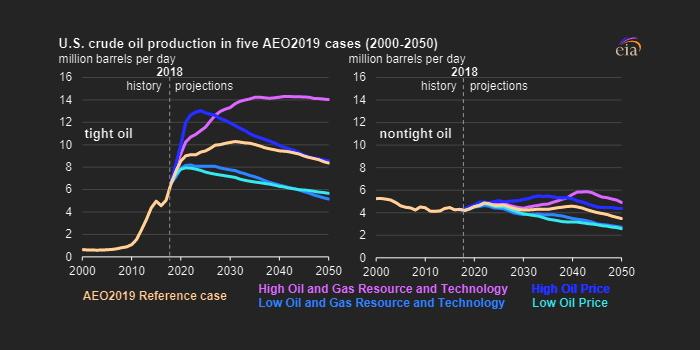
U.S. EIA - In the first half of 2019, the United States exported 5.47 million barrels per day (b/d) of petroleum products, an increase of 19,000 b/d (0.3%) from the first half of 2018 and the slowest year-over-year growth rate for any half year in 13 years. Lower U.S. refinery runs in the first half of 2019 compared with the first half of 2018 and slowing global economic growth, which is limiting demand for petroleum products, likely contributed to lower exports. In the first half of 2019, increased exports of propane and distillate offset decreased exports of all other petroleum products (Figure 1).

Distillate remained the top petroleum product export by volume in the first half of 2019, averaging 1.3 million b/d, an increase of 60,000 b/d (5%) compared with the first half of 2018. Distillate has many uses, including transportation, manufacturing, agriculture, residential, and commercial. Mexico is the top destination for U.S. distillate exports, receiving 290,000 b/d, or 22% of total U.S. distillate exports (Figure 2). Aside from Mexico, U.S. distillate exports go mostly to Central and South America, including Brazil (13%), Chile (7%), and Peru (5%). U.S. distillate exports also go to Europe, mostly to the Netherlands (4%), a transshipment country for some of the U.S. distillate volumes.

Propane was the second-largest U.S. petroleum product export in the first half of 2019 at 1.03 million b/d, which is an increase of 142,000 b/d (16%) from the first half of 2018. Propane is used as a space heating fuel, transportation fuel, or as a petrochemical feedstock. Most U.S. exports of propane are destined for use as a petrochemical feedstock, mainly at facilities in Asia and Europe.
In the second half of 2018, China increased import tariffs on U.S. propane, resulting in significant changes in both the destinations for U.S. propane exports and the amount going to each destination as prices and markets adjusted. Even though Japan, Mexico, and South Korea remained the top three destinations for U.S. propane exports, the volume going to Japan nearly doubled, from 188,000 b/d in the first half of 2018 to 334,000 b/d in the first half of 2019, an increase of 146,000 b/d (78%) (Figure 3). Meanwhile, U.S. exports of propane to China fell from 74,000 b/d to 4,000 b/d during the first half of 2019.

Unlike the significant differences in U.S. propane exports between the first half of 2018 through the first half of 2019, U.S. motor gasoline exports were mostly stable. The United States exported 901,000 b/d of motor gasoline in the first half of 2019, and more than 50% went to Mexico. Other U.S. motor gasoline exports go mostly to Central and South America; exports to Brazil increased 26,000 b/d (71%) when comparing the first half of 2018 to the first half of 2019 (Figure 4). After sanctions were placed on Venezuela in early 2019, U.S. exports of gasoline to Venezuela decreased from 30,000 b/d in the first half of 2018 to 8,000 b/d (73%) in the first half of 2019.

Residual fuel exports declined the most when comparing the first half of 2019 with the first half of 2018, falling by 74,000 b/d to average 258,000 b/d. In the first half of 2018, Singapore was the top destination for U.S. residual fuel exports, most likely to supply Singapore's marine bunkering market. However, in the first half of 2019, trade press sources indicated that Singapore's bunker market was preparing for new international regulations that limit the sulfur content of marine fuels fuels by drawing down higher sulfur residual inventories to make room for inventories that are lower in sulfur. As a result, U.S. exports of residual fuel oil to Singapore decreased 68,000 b/d (80%) in the first half of 2019 compared with the first half of 2018.
Continued growth in petroleum product exports, albeit slower than in previous years, combined with increasing U.S. crude oil exports will result in the United States becoming a total petroleum net exporter. The U.S. Energy Information Administration's (EIA) October 2019 Short-Term Energy Outlook forecasts this change to occur in the fourth quarter of 2019.
U.S. average regular gasoline prices rise, diesel prices fall slightly
The U.S. average regular gasoline retail price rose 1 cent from the previous week to $2.64 per gallon on October 21, 20 cents lower than the same time last year. The Rocky Mountain and Gulf Coast prices each rose by more than 2 cents to $2.73 per gallon and $2.28 per gallon, respectively, and the East Coast price rose by 2 cents to $2.48 per gallon, The West Coast price fell by nearly 2 cents to $3.65 per gallon, and the Midwest price fell by less than a cent, remaining at $2.48 per gallon.
The U.S. average diesel fuel price declined by less than 1 cent and remained at $3.05 per gallon on October 21, 33 cents lower than a year ago. The West Coast price increased by more than 2 cents to $3.68 per gallon, and East Coast and Rocky Mountain prices each rose by less than 1 cent to $3.05 per gallon and $3.04 per gallon, respectively. The Midwest price declined by 1 cent to $2.96 per gallon, and the Gulf Coast price fell by less than 1 cent to $2.80 per gallon.
Residential heating fuel prices increase
As of October 21, 2019, residential heating oil prices averaged $2.97 per gallon, more than 1 cent per gallon above last week's price but nearly 41 cents per gallon below last year's price at this time. Wholesale heating oil prices averaged $2.05 per gallon, more than 1 cent per gallon less than last week's price and 34 cents per gallon less than a year ago.
Residential propane prices averaged $1.85 per gallon, less than 1 cent per gallon higher than last week's price but 57 cents per gallon lower than a year ago. Wholesale propane prices averaged $0.60 per gallon, slightly higher than last week's price and almost 41 cents per gallon below last year's price.
Propane/propylene inventories decline
U.S. propane/propylene stocks decreased by 0.5 million barrels last week to 100.0 million barrels as of October 18, 2019, 10.9 million barrels (12.2%) greater than the five-year (2014-2018) average inventory levels for this same time of year. Gulf Coast and Midwest inventories decreased by 0.7 million barrels and 0.4 million barrels, respectively. East Coast and Rocky Mountain/West Coast inventories increased by 0.5 million barrels and 0.1 million barrels, respectively. Propylene non-fuel-use inventories represented 4.7% of total propane/propylene inventories.
-----
Earlier:
2019, October, 23, 11:50:00
U.S. OIL MAXIMUM
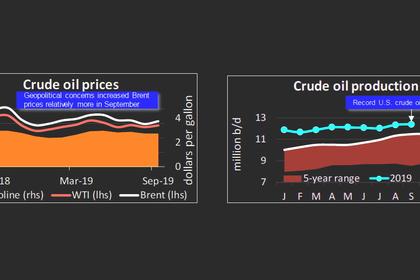
The brisk pace of U.S. production, now the world’s largest, in the past few years has been a key factor behind the relative weakness in oil prices. Output has slowed recently, however.
2019, October, 21, 13:30:00
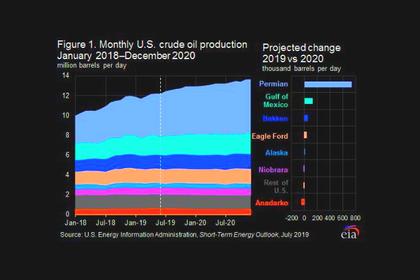
U.S. OIL PRODUCTION 12.4 MBD
U.S. crude oil production reached a new all-time high of 12.4 million barrels per day (mb/d) – and U.S. natural gas liquids production sustained a record 4.8 mb/d – in September,
2019, October, 16, 12:30:00
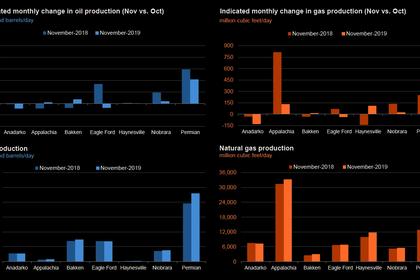
U.S. PRODUCTION: OIL + 58 TBD, GAS + 319 MCFD
Crude oil production from the major US onshore regions is forecast to increase 58,000 b/d month-over-month in October from 8,913 to 8,971 thousand barrels/day, gas production to increase 319 million cubic feet/day from 83,693 to 84,012 million cubic feet/day .
2019, October, 16, 12:20:00
U.S. OIL FOR S.KOREA DOUBLED
South Korea's crude oil imports from the US in September more than doubled from a year earlier, while intakes of Saudi crude dropped 17.6% year on year due to the September 14 attacks on Saudi's major oil facilities,


