2019-11-06 12:35:00


U.S. INTERNATIONAL TRADE DEFICIT $52.5 BLN
U.S. BEA - NOVEMBER 5, 2019 - U.S. International Trade in Goods and Services, September 2019
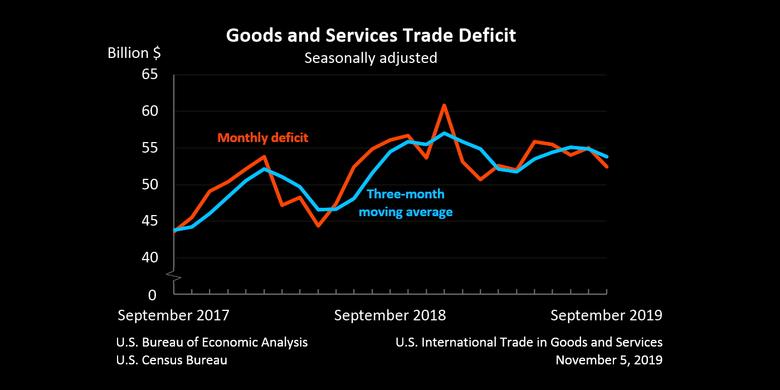
The U.S. Census Bureau and the U.S. Bureau of Economic Analysis announced today that the goods and services deficit was $52.5 billion in September, down $2.6 billion from $55.0 billion in August, revised.
| Deficit: | $52.5 Billion | -4.7%° |
| Exports: | $206.0 Billion | -0.9%° |
| Imports: | $258.4 Billion | -1.7%° |
|
Next release: December 5, 2019 (°) Statistical significance is not applicable or not measurable. Data adjusted for seasonality but not price changes Source: U.S. Census Bureau, U.S. Bureau of Economic Analysis; U.S. International Trade in Goods and Services, November 5, 2019 |
||
Exports, Imports, and Balance (exhibit 1)
September exports were $206.0 billion, $1.8 billion less than August exports. September imports were $258.4 billion, $4.4 billion less than August imports.
The September decrease in the goods and services deficit reflected a decrease in the goods deficit of $2.7 billion to $71.7 billion and a decrease in the services surplus of $0.1 billion to $19.3 billion.
Year-to-date, the goods and services deficit increased $24.8 billion, or 5.4 percent, from the same period in 2018. Exports decreased $7.0 billion or 0.4 percent. Imports increased $17.8 billion or 0.8 percent.
Three-Month Moving Averages (exhibit 2)
The average goods and services deficit decreased $1.0 billion to $53.8 billion for the three months ending in September.
- Average exports decreased $0.1 billion to $207.1 billion in September.
- Average imports decreased $1.1 billion to $260.9 billion in September.
Year-over-year, the average goods and services deficit decreased $0.6 billion from the three months ending in September 2018.
- Average exports decreased $1.7 billion from September 2018.
- Average imports decreased $2.3 billion from September 2018.
Exports (exhibits 3, 6, and 7)
Exports of goods decreased $1.8 billion to $136.8 billion in September.
Exports of goods on a Census basis decreased $1.9 billion.
- Foods, feeds, and beverages decreased $1.5 billion.
- Soybeans decreased $1.0 billion.
- Automotive vehicles, parts, and engines decreased $1.0 billion.
- Passenger cars decreased $0.3 billion.
- Trucks, buses, and special purpose vehicles decreased $0.3 billion.
- Capital goods increased $0.8 billion.
- Civilian aircraft increased $0.7 billion.
- Civilian aircraft engines increased $0.6 billion.
Net balance of payments adjustments increased $0.1 billion.
Exports of services decreased $0.1 billion to $69.2 billion in September.
- Travel decreased $0.1 billion.
Imports (exhibits 4, 6, and 8)
Imports of goods decreased $4.5 billion to $208.6 billion in September.
Imports of goods on a Census basis decreased $4.3 billion.
- Consumer goods decreased $2.5 billion.
- Cell phones and other household goods decreased $0.8 billion.
- Toys, games, and sporting goods decreased $0.6 billion.
- Artwork, antiques, stamps, and other collectibles decreased $0.4 billion.
- Capital goods decreased $1.1 billion.
- Semiconductors decreased $0.6 billion.
- Automotive vehicles, parts, and engines decreased $1.1 billion.
- Trucks, buses, and special purpose vehicles decreased $0.4 billion.
- Automotive parts and accessories decreased $0.3 billion.
- Passenger cars decreased $0.3 billion.
Net balance of payments adjustments decreased $0.2 billion.
Imports of services increased $0.1 billion to $49.9 billion in September, reflecting small (less than $50 million) changes in all major service categories.
Real Goods in 2012 Dollars – Census Basis (exhibit 11)
The real goods deficit decreased $3.1 billion to $82.6 billion in September.
- Real exports of goods decreased $1.5 billion to $148.8 billion.
- Real imports of goods decreased $4.6 billion to $231.5 billion.
Revisions
Revisions to August exports
- Exports of goods were revised up less than $0.1 billion.
- Exports of services were revised down $0.1 billion.
Revisions to August imports
- Imports of goods were revised up less than $0.1 billion.
- Imports of services were revised up $0.1 billion.
Goods by Selected Countries and Areas: Monthly – Census Basis (exhibit 19)
The September figures show surpluses, in billions of dollars, with South and Central America ($5.0), Hong Kong ($2.1), Brazil ($1.0), OPEC ($1.0), Singapore ($0.9), United Kingdom ($0.7), and Saudi Arabia ($0.3). Deficits were recorded, in billions of dollars, with China ($28.0), European Union ($15.7), Mexico ($9.1), Japan ($5.9), Germany ($5.0), Italy ($3.0), Canada ($2.5), Taiwan ($2.1), India ($2.0), France ($1.7), and South Korea ($1.2).
- The deficit with Germany decreased $1.9 billion to $5.0 billion in September. Exports increased $0.7 billion to $5.6 billion and imports decreased $1.2 billion to $10.7 billion.
- The deficit with China decreased $0.9 billion to $28.0 billion in September. Exports decreased $1.0 billion to $9.0 billion and imports decreased $1.9 billion to $37.0 billion.
- The deficit with Canada increased $0.9 billion to $2.5 billion in September. Exports decreased $0.3 billion to $24.5 billion and imports increased $0.6 billion to $27.0 billion.
-----
Earlier:
2019, November, 1, 13:30:00
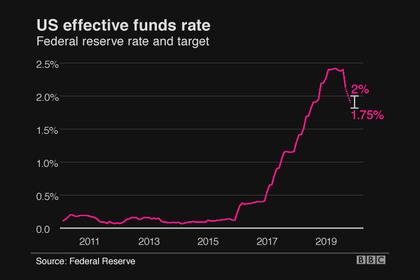
U.S. FEDERAL FUNDS RATE 1.5 - 1.75%
Consistent with its statutory mandate, the Committee seeks to foster maximum employment and price stability. In light of the implications of global developments for the economic outlook as well as muted inflation pressures, the Committee decided to lower the target range for the federal funds rate to 1-1/2 to 1-3/4 percent.
2019, October, 28, 14:00:00
U.S. SHALE DOWN
Investors are bracing for weaker results from U.S. shale players in coming days as lower oil and natural gas prices and cost-cutting measures have weighed on third-quarter operations.
2019, October, 21, 13:25:00
U.S. TRADE WARS
The collateral damage of the United States’ trade wars is being felt from the fjords of Iceland to the auto factories of Japan.


