2019-11-06 12:30:00


U.S. UNEMPLOYMENT 3.6%
U.S. BLS - November 1, 2019 - THE EMPLOYMENT SITUATION -- OCTOBER 2019
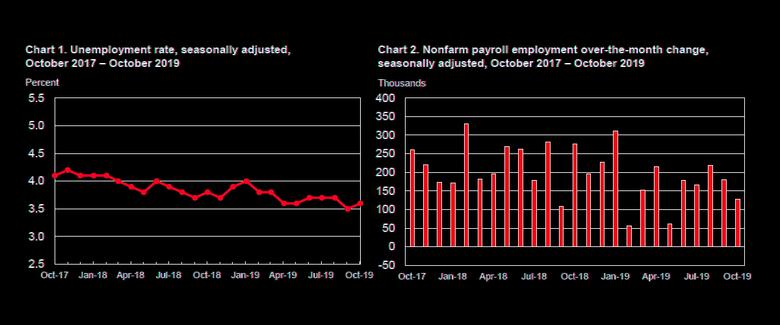
Total nonfarm payroll employment rose by 128,000 in October, and the unemployment rate was little changed at 3.6 percent, the U.S. Bureau of Labor Statistics reported today. Notable job gains occurred in food services and drinking places, social assistance, and financial activities.
Within manufacturing, employment in motor vehicles and parts decreased due to strike activity. Federal government employment was down, reflecting a drop in the number of temporary jobs for the 2020 Census.
This news release presents statistics from two monthly surveys. The household survey measures labor force status, including unemployment, by demographic characteristics. The establishment survey measures nonfarm employment, hours, and earnings by industry. For more information about the concepts and statistical methodology used in these two surveys, see the Technical Note.
Household Survey Data
Both the unemployment rate, at 3.6 percent, and the number of unemployed persons, at 5.9 million, changed little in October. (See table A-1.) Among the major worker groups, the unemployment rates for adult men (3.2 percent), adult women (3.2 percent), teenagers (12.3 percent), Whites (3.2 percent), Blacks (5.4 percent), Asians (2.9 percent), and Hispanics (4.1 percent) showed little or no change in October. (See tables A-1, A-2, and A-3.)
The number of long-term unemployed (those jobless for 27 weeks or more) was essentially unchanged at 1.3 million in October and accounted for 21.5 percent of the unemployed. (See table A-12.)
The labor force participation rate was little changed at 63.3 percent in October, and the employment-population ratio held at 61.0 percent. Both measures were up by 0.4 percentage point over the year. (See table A-1.)
The number of persons employed part time for economic reasons, at 4.4 million, changed little in October. These individuals, who would have preferred full-time employment, were working part time because their hours had been reduced or they were unable to find full-time jobs. (See table A-8.)
In October, 1.2 million persons were marginally attached to the labor force, down by 262,000 from a year earlier. (Data are not seasonally adjusted.)
These individuals were not in the labor force, wanted and were available for work, and had looked for a job sometime in the prior 12 months. They were not counted as unemployed because they had not searched for work in the 4 weeks preceding the survey. (See table A-16.)
Among the marginally attached, there were 341,000 discouraged workers in October, down by 165,000 from a year earlier. (Data are not seasonally adjusted.) Discouraged workers are persons not currently looking for work because they believe no jobs are available for them. The remaining 888,000 persons marginally attached to the labor force in October had not searched for work for reasons such as school attendance or family responsibilities. (See table A-16.)
Establishment Survey Data
Total nonfarm payroll employment increased by 128,000 in October. Job growth has averaged 167,000 per month thus far in 2019, compared with an average monthly gain of 223,000 in 2018. In October, notable job gains occurred in food services and drinking places, social assistance, and financial activities.
Employment declined in motor vehicles and parts manufacturing due to strike activity. Federal government employment also was down, reflecting a drop in the number of temporary jobs for the 2020 Census. (See table B-1.)
In October, food services and drinking places added 48,000 jobs. Job growth in the industry has averaged 38,000 over the past 3 months, compared with an average monthly gain of 16,000 in the first 7 months of 2019.
Employment in social assistance increased by 20,000 in October and by 139,000 over the last 12 months. Most of the gain occurred in individual and family services, which added 17,000 jobs over the month and 111,000 over the year.
In October, employment in financial activities rose by 16,000, with gains in real estate and rental and leasing (+10,000) and in credit intermediation and related activities (+6,000). Financial activities has added 108,000 jobs over the last 12 months.
Employment in professional and business services continued to trend up in October (+22,000). The industry has added an average of 33,000 jobs per month thus far in 2019, compared with an average gain of 47,000 jobs per month in 2018.
Health care employment continued on an upward trend in October (+15,000).
Health care has added 402,000 jobs over the last 12 months.
Manufacturing employment decreased by 36,000 in October. Within manufacturing, employment in motor vehicles and parts declined by 42,000, reflecting strike activity.
Federal government employment was down by 17,000 over the month, as 20,000 temporary workers who had been preparing for the 2020 Census completed their work.
Employment in other major industries--including mining, construction, wholesale trade, retail trade, transportation and warehousing, and information--showed little change over the month.
In October, average hourly earnings for all employees on private nonfarm payrolls rose by 6 cents to $28.18. Over the past 12 months, average hourly earnings have increased by 3.0 percent. In October, average hourly earnings of private-sector production and nonsupervisory employees rose by 4 cents to $23.70. (See tables B-3 and B-8.)
The average workweek for all employees on private nonfarm payrolls was unchanged at 34.4 hours in October. In manufacturing, the average workweek decreased by 0.2 hour to 40.3 hours, while overtime was unchanged at 3.2 hours. The average workweek of private-sector production and nonsupervisory employees held at 33.6 hours. (See tables B-2 and B-7.)
The change in total nonfarm payroll employment for August was revised up by 51,000 from +168,000 to +219,000, and the change for September was revised up by 44,000 from +136,000 to +180,000. With these revisions, employment gains in August and September combined were 95,000 more than previously reported. (Monthly revisions result from additional reports received from businesses and government agencies since the last published estimates and from the recalculation of seasonal factors.)
After revisions, job gains have averaged 176,000 over the last 3 months.
-----
Earlier:
2019, November, 1, 13:30:00
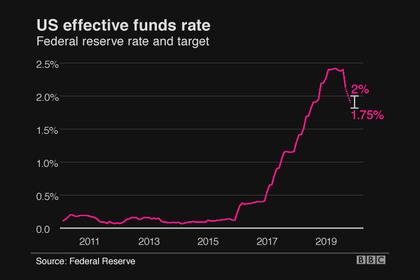
U.S. FEDERAL FUNDS RATE 1.5 - 1.75%
Consistent with its statutory mandate, the Committee seeks to foster maximum employment and price stability. In light of the implications of global developments for the economic outlook as well as muted inflation pressures, the Committee decided to lower the target range for the federal funds rate to 1-1/2 to 1-3/4 percent.
2019, October, 28, 14:00:00
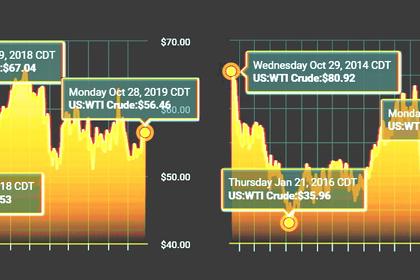
U.S. SHALE DOWN
Investors are bracing for weaker results from U.S. shale players in coming days as lower oil and natural gas prices and cost-cutting measures have weighed on third-quarter operations.
2019, October, 21, 13:25:00
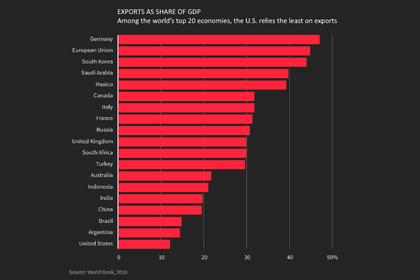
U.S. TRADE WARS
The collateral damage of the United States’ trade wars is being felt from the fjords of Iceland to the auto factories of Japan.


